Teacher GuideâEarth Science Module - Estuaries NOAA
Teacher GuideâEarth Science Module - Estuaries NOAA
Teacher GuideâEarth Science Module - Estuaries NOAA

You also want an ePaper? Increase the reach of your titles
YUMPU automatically turns print PDFs into web optimized ePapers that Google loves.
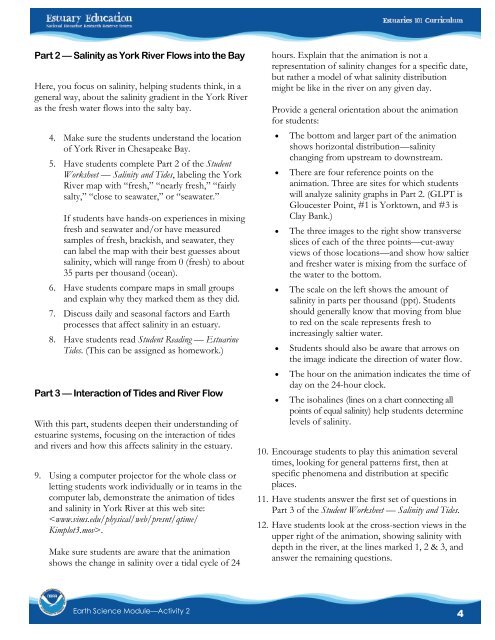
Part 2 — Salinity as York River Flows into the BayHere, you focus on salinity, helping students think, in ageneral way, about the salinity gradient in the York Riveras the fresh water flows into the salty bay.4. Make sure the students understand the locationof York River in Chesapeake Bay.5. Have students complete Part 2 of the StudentWorksheet — Salinity and Tides, labeling the YorkRiver map with “fresh,” “nearly fresh,” “fairlysalty,” “close to seawater,” or “seawater.”If students have hands-on experiences in mixingfresh and seawater and/or have measuredsamples of fresh, brackish, and seawater, theycan label the map with their best guesses aboutsalinity, which will range from 0 (fresh) to about35 parts per thousand (ocean).6. Have students compare maps in small groupsand explain why they marked them as they did.7. Discuss daily and seasonal factors and Earthprocesses that affect salinity in an estuary.8. Have students read Student Reading — EstuarineTides. (This can be assigned as homework.)Part 3 — Interaction of Tides and River FlowWith this part, students deepen their understanding ofestuarine systems, focusing on the interaction of tidesand rivers and how this affects salinity in the estuary.9. Using a computer projector for the whole class orletting students work individually or in teams in thecomputer lab, demonstrate the animation of tidesand salinity in York River at this web site:.Make sure students are aware that the animationshows the change in salinity over a tidal cycle of 24hours. Explain that the animation is not arepresentation of salinity changes for a specific date,but rather a model of what salinity distributionmight be like in the river on any given day.Provide a general orientation about the animationfor students: The bottom and larger part of the animationshows horizontal distribution—salinitychanging from upstream to downstream. There are four reference points on theanimation. Three are sites for which studentswill analyze salinity graphs in Part 2. (GLPT isGloucester Point, #1 is Yorktown, and #3 isClay Bank.) The three images to the right show transverseslices of each of the three points—cut-awayviews of those locations—and show how saltierand fresher water is mixing from the surface ofthe water to the bottom. The scale on the left shows the amount ofsalinity in parts per thousand (ppt). Studentsshould generally know that moving from blueto red on the scale represents fresh toincreasingly saltier water. Students should also be aware that arrows onthe image indicate the direction of water flow. The hour on the animation indicates the time ofday on the 24-hour clock. The isohalines (lines on a chart connecting allpoints of equal salinity) help students determinelevels of salinity.10. Encourage students to play this animation severaltimes, looking for general patterns first, then atspecific phenomena and distribution at specificplaces.11. Have students answer the first set of questions inPart 3 of the Student Worksheet — Salinity and Tides.12. Have students look at the cross-section views in theupper right of the animation, showing salinity withdepth in the river, at the lines marked 1, 2 & 3, andanswer the remaining questions.Earth <strong>Science</strong> <strong>Module</strong>—Activity 24