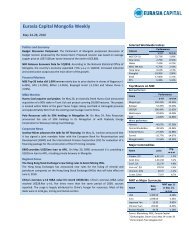
<strong>Mongolia</strong> <strong>Weekly</strong> (March 28-<strong>April</strong> 1, <strong>2011</strong>)<strong>April</strong> 4, <strong>2011</strong> (Monday)ECONOMIC PERFORMANCEIndicator 2003 2004 2005 2006 2007 2008 2009 2010 <strong>2011</strong>fPopulation and incomePopulation, mn 2.50 2.53 2.56 2.59 2.63 2.68 2.74 2.65* 2.66GDP per capita, US$ 582 720 905 1224 1503 1940 1560 2490 3270National accountsNominal GDP, MNTbn 1660 2152 2780 3715 4599.5 6555 6591 8255 9900Nominal GDP, US$bn 1.4 1.8 2.3 3.2 3.9 5.1 4.6 6.6 8.8Real GDP growth, y-o-y, % 7.0 10.6 7.2 8.6 10.2 8.9 -1.3 6.1 10Monetary indicators and inflationM2 growth, y-o-y, % 49.6 20.4 34.6 34.8 56.3 -5.5 26.9 62.5 50.0CPI, y-o-y, % 4.7 11 9.2 4.8 14.1 22.1 4.2 13.0 25.0Exchange rate, MNT/US$, end-year 1168 1209 1221 1165 1170 1267 1443 1257 1130International reserves, US$mn - 208 333 718 1001 657 822 2000 2300Government financeRevenue, % of GDP - 33.1 30.1 36.6 40.9 35.4 32.9 37.3 42.2Expenditure, % of GDP - 35.0 27.5 28.5 38.0 40.2 38.3 37.3 52.1Budget balance, % of GDP -4.2 -2.1 3.2 3.9 2.2 -5.0 -5.4 0 -9.9Balance of paymentsExports, US$mn 615.9 872 1069 1545 1952 2539 1885 2899 3769Imports, US$mn 801 1021 1224 1516 2170 3616 2138 3278 4425Exports, y-o-y, % 17.5 41.2 22.4 44.9 22.5 30.3 -24.9 53.8 30.0Imports, y-o-y, % 16.0 27.5 16.0 25.4 36.1 66.6 -34.3 53.3 35.0Trade balance, US$mn -185.1 -149 -155 30 -218 -1077 -229 -379 -656FDI, US$mn 131.5 92.9 182.3 367 500 709 801 1400 2000Source: National Statistics Office of <strong>Mongolia</strong>, the Bank of <strong>Mongolia</strong>, the IMF, the World Bank, <strong>Eurasia</strong> <strong>Capital</strong>. *According to November 2010Population and Housing Censuswww.eurasiac.com 14
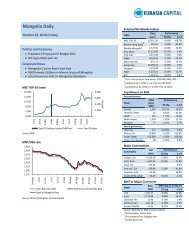
<strong>Mongolia</strong> <strong>Weekly</strong> (March 28-<strong>April</strong> 1, <strong>2011</strong>)<strong>April</strong> 4, <strong>2011</strong> (Monday)MSE AND MONGOLIA FOCUSED INTERNATIONAL MINING COMPANYSTOCKS PERFORMANCE SUMMARYMSE TOP-20 Performance (March 28-<strong>April</strong> 1, <strong>2011</strong>)Daily TurnoverPrice Performance Market CapCode Name(52Wk Avg)Close 52 Wk high 52 Wk low w-o-w y-t-d MNTmn US$mn MNT US$396 Baganuur 24,000 41,780 2,800 7.62% 128.6% 503,385 421.1 91,715,582 76,732458 Tavan Tolgoi 948,750 1,439,000 190,000 5.53% 64.7% 499,661 418.0 16,364,799 13,691460 Shivee Ovoo 32,000 62,300 4,260 6.67% 146.2% 429,411 359.3 15,420,837 12,90290 APU 3,200 3,750 1,550 -5.88% 60.8% 237,721 198.9 15,107,730 12,640309 Sharyn Gol 22,700 35,099 3,002 -4.22% 116.2% 193,494 161.9 82,359,954 68,905209 <strong>Mongolia</strong>n Telecom 3,300 4,501 2,900 3.13% -5.7% 85,372 71.4 1,449,782 1,213461 Aduunchuluun 15,900 31,405 450 13.33% 98.8% 50,106 41.9 4,154,004 3,475522 BDSec 4,000 5,900 2,200 5.26% 60.0% 44,000 36.8 10,318,158 8,632354 Gobi 5,500 7,700 5,200 0.00% -1.8% 42,906 35.9 14,297,074 11,961444 Mogoin Gol 38,910 66,463 2,357 -0.49% 229.7% 32,281 27.0 3,644,763 3,049524<strong>Mongolia</strong> DevelopmentResources1,700 2,300 990 0.00% 30.8% 23,375 19.6 14,080,666 11,780532 Khukh Gan 199 217 146 13.71% 6.4% 20,162 16.9 10,655,787 8,915484 State Department Store 520 900 400 4.00% 20.9% 19,140 16.0 2,132,056 1,78413 Bayangol Hotel 29,000 36,450 22,000 5.45% 21.3% 12,269 10.3 1,569,850 1,3133 UB Hotel 35,000 55,000 25,000 -12.50% 27.3% 11,735 9.8 6,058,642 5,069191 Eermel 3,101 6,468 1,151 -3.09% 7.9% 10,789 9.0 360,096 301530 Remicon 134 147 39 0.00% 86.1% 10,543 8.8 2,308,403 1,931521 Genco Tour Bureau 95 118 88 0.00% 1.1% 10,450 8.7 1,720,425 1,439208 Makh Impex 2,162 4,866 1,200 0.42% 20.1% 8,217 6.9 1,223,525 1,02471 Darkhan Nekhii 5,000 10,780 2,100 2.29% 2.0% 5,527 4.6 867,976 726Source: MSE, Bank of <strong>Mongolia</strong>, <strong>Eurasia</strong> <strong>Capital</strong>Selected Non-MSE TOP-20 Member Leading Market Cap Companies (March 28-<strong>April</strong> 1, <strong>2011</strong>)Daily Turnover 1WkPrice Market Cap PerformanceCode Name(52Wk Avg) turnoverMNT US$ MNTmn US$mn w-o-w y-t-d MNT US$ (MNT)22 Talkh Chikher 12,200 10.21 12,489.2 10.4 -2.4% 229.7% 546,746 457 929,385135 Suu 35,700 29.87 12,280.8 10.3 -15.0% 70.1% 110,680 93 3,320,100517 Hotel <strong>Mongolia</strong> 615 0.51 6,150.0 5.1 -3.9% 9.8% 47,795 40 1,860528 Hermes 54 0.05 4,241.3 3.5 1.9% 0.0% 1,816,630 1,520 4,236,665531 Nako Tulsh 300 0.25 3,784.7 3.2 0.0% -7.7% 4,311,599 3,607 24,645,000Source: MSE, Bank of <strong>Mongolia</strong>, <strong>Eurasia</strong> <strong>Capital</strong>www.eurasiac.com 15