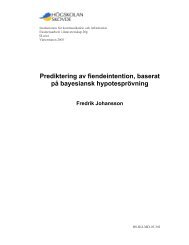
would mean that we would be looking at a stable distributi<strong>on</strong> of values, thus making iteasier to harness <strong>the</strong> subagent. Except for a few stray values, most values lie between–0.10 and 0.10, omitting <strong>the</strong> unit, as it has no bearing.Having obtained this result, I proceeded to test for all pairs of values ofthresholds of purchase and thresholds of sale, spanning <strong>the</strong> interval between –0.15 and0.15 (I chose to have an extra margin of 0.05) <strong>with</strong> an interval of 0.01 in betweenvalues. The outcome of <strong>the</strong>se tests can be seen in Chart 2 and Chart 3 (next page). Ineach case <strong>the</strong> subagent was given an initial amount of 10,000 Swedish crowns (SEK).I made <strong>the</strong> ra<strong>the</strong>r simplifying assumpti<strong>on</strong> that <strong>the</strong> total cost of transacti<strong>on</strong> would be0.05 per cent of <strong>the</strong> absolute worth of <strong>the</strong> stock traded, for both purchase and sale. Iopted for this low cost for a few reas<strong>on</strong>s. Firstly, <strong>the</strong> Internet based broker Avanza(www.avanza.se) offers a brokerage of 0.12 per cent. That should set an upperboundary for <strong>the</strong> transacti<strong>on</strong> fee. Sec<strong>on</strong>d, as a trading agent initiates all transacti<strong>on</strong>s<strong>on</strong> its own, starting or stopping a full run of <strong>the</strong>se agents could be looked up<strong>on</strong> as asingle separate type of order, just like an ordinary limit order, for example. Therewould not be any need for any communicati<strong>on</strong> <strong>with</strong> outer sources except at <strong>the</strong> verystart and at <strong>the</strong> very end of a run.Apart from <strong>the</strong> transacti<strong>on</strong> fee, <strong>the</strong>re is also <strong>the</strong> implicit transacti<strong>on</strong> cost of <strong>the</strong>spread (<strong>the</strong> difference between <strong>the</strong> highest bid and <strong>the</strong> lowest ask price in a doubleaucti<strong>on</strong>). It would have been impossible for me to simulate a real stock market, and<strong>the</strong>reby <strong>the</strong> cost of <strong>the</strong> spread, in a realistic way. Instead I made <strong>the</strong> idealisticassumpti<strong>on</strong> that I could sell or buy stocks at <strong>the</strong> rate I had used for my predictivecalculati<strong>on</strong>s, i.e., <strong>the</strong> rates would not be affected by <strong>the</strong> agents’ orders and <strong>the</strong> stockmarket would be extremely liquid.In <strong>the</strong> charts (2 and 3) every crossing of two lines in <strong>the</strong> landscapes represents apair of parameters (threshold values). The performance of <strong>the</strong> corresp<strong>on</strong>ding ‘Buy andHold’ strategy is also given in <strong>the</strong> headings of <strong>the</strong> individual charts.Searching for patterns in <strong>the</strong>se landscapes, I immediately recognised <strong>the</strong> plateauxand valleys in <strong>the</strong> lower and right quarters of <strong>the</strong> charts (looking at <strong>the</strong> charts as <strong>the</strong>yare displayed). In Chart 3, corresp<strong>on</strong>ding to a fall of <strong>the</strong> exchange, <strong>the</strong>re is a plateau in<strong>the</strong> right quarter and a valley in <strong>the</strong> lower quarter. This corresp<strong>on</strong>ds to high values forboth <strong>the</strong> threshold of sale and <strong>the</strong> threshold of purchase, and to high values for <strong>the</strong>threshold of sale and low values for <strong>the</strong> threshold of purchase, respectively. Here Imust point out that at <strong>the</strong> very edge of <strong>the</strong> right corner, just a few or no transacti<strong>on</strong>shave taken place. The threshold of purchase is set at a level too high for anytransacti<strong>on</strong> to be initiated, except for possibly a few stray transacti<strong>on</strong>s. If bought, astock would immediately be sold owing to <strong>the</strong> very high-set threshold of sale. In <strong>the</strong>chart pertaining to a rise of <strong>the</strong> exchange (Chart 2), <strong>the</strong> reverse scenario arises. In thischart <strong>the</strong>re is a plateau in <strong>the</strong> lower quarter and a lowland plain in <strong>the</strong> right quarter.The plateau corresp<strong>on</strong>ds to a high value for <strong>the</strong> threshold of sale and a low value for<strong>the</strong> threshold of purchase, and <strong>the</strong> valley corresp<strong>on</strong>ds to high values for both <strong>the</strong>threshold of sale and <strong>the</strong> threshold of purchase.The results are not too ast<strong>on</strong>ishing. They just state that it is always good to sellearly so that you can switch to <strong>the</strong> best performing stocks, that in bad times youshould <strong>on</strong>ly invest in stocks <strong>with</strong> really good prospects, and that in good times <strong>on</strong>eshould aim at always remaining invested in shares.I decided to take a closer look at this pattern, focusing <strong>on</strong> <strong>the</strong> area close to <strong>the</strong>centre of <strong>the</strong> charts <strong>with</strong> <strong>the</strong>ir high peaks and deep valleys, i.e., <strong>the</strong> area where mostvalues of functi<strong>on</strong> (1) were centred, to see whe<strong>the</strong>r it had any kind of generality ornot. For this purpose I used samples 3 to 58 (appendix), in all 56 samples. 28 samples9
Chart 2, 26 Feb 99 - 25 Feb 00, sample 1. Interval in between threshold values 0.01.'Buy and Hold': 16070 SEK.40000350003000025000200001500010000Total sum at end of period(SEK).35000-4000030000-3500025000-3000020000-25000500015000-20000Threshold of sale-0.15-0.10000002-0.05-1.75E-090.0499999970.100000020.15 S1S10S19S28S37S46S550Threshold of purchase,S1= - 0.15, S61=0.15 .10000-150005000-100000-5000Chart 3, 28 Feb 00 - 23 Feb 01, sample 2. Interval in between threshold values 0.01.'Buy and Hold': 6960 SEK.20000-0.15-0.09500001-0.0400000030.0149999980.07Threshold of sale 0.12500003S1S8S15S22S29S36S43S50S57180001600014000120001000080006000400020000Threshold of purchase,S1=- 0.15, S61=0.15 .Total sum at end of period(SEK).18000-2000016000-1800014000-1600012000-1400010000-120008000-100006000-80004000-60002000-40000-200010
- Page 1 and 2: Improved P
- Page 3 and 4: mathematical sign that all is not a
- Page 5 and 6: If the model corresponds well with
- Page 7 and 8: this purpose I designed a subagent
- Page 9: exceeded a threshold value, set bef
- Page 13 and 14: Chart 4, Average of 28 samples, 26
- Page 15 and 16: Table 4. The choice of subagent.The
- Page 17 and 18: separately (compare with results of
- Page 19 and 20: interesting to see how much time th
- Page 21 and 22: As I have already indicated in a pr
- Page 23 and 24: [Blume and Easley, 1990] L. Blume,
- Page 25 and 26: B, SHB-ATEL2-B,VOLV-B,WM-B, STE-R,A