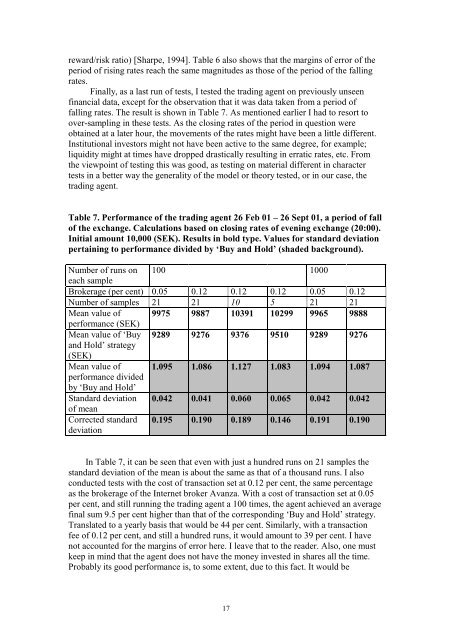
eward/risk ratio) [Sharpe, 1994]. Table 6 also shows that <strong>the</strong> margins of error of <strong>the</strong>period of rising rates reach <strong>the</strong> same magnitudes as those of <strong>the</strong> period of <strong>the</strong> fallingrates.Finally, as a last run of tests, I tested <strong>the</strong> trading agent <strong>on</strong> previously unseenfinancial data, except for <strong>the</strong> observati<strong>on</strong> that it was data taken from a period offalling rates. The result is shown in Table 7. As menti<strong>on</strong>ed earlier I had to resort toover-sampling in <strong>the</strong>se tests. As <strong>the</strong> closing rates of <strong>the</strong> period in questi<strong>on</strong> wereobtained at a later hour, <strong>the</strong> movements of <strong>the</strong> rates might have been a little different.Instituti<strong>on</strong>al investors might not have been active to <strong>the</strong> same degree, for example;liquidity might at times have dropped drastically resulting in erratic rates, etc. From<strong>the</strong> viewpoint of testing this was good, as testing <strong>on</strong> material different in charactertests in a better way <strong>the</strong> generality of <strong>the</strong> model or <strong>the</strong>ory tested, or in our case, <strong>the</strong>trading agent.Table 7. Performance of <strong>the</strong> trading agent 26 Feb 01 – 26 Sept 01, a period of fallof <strong>the</strong> exchange. Calculati<strong>on</strong>s based <strong>on</strong> closing rates of evening exchange (20:00).Initial amount 10,000 (SEK). Results in bold type. Values for standard deviati<strong>on</strong>pertaining to performance divided by ‘Buy and Hold’ (shaded background).Number of runs <strong>on</strong> 100 1000each sampleBrokerage (per cent) 0.05 0.12 0.12 0.12 0.05 0.12Number of samples 21 21 10 5 21 21Mean value of 9975 9887 10391 10299 9965 9888performance (SEK)Mean value of ‘Buy 9289 9276 9376 9510 9289 9276and Hold’ strategy(SEK)Mean value of 1.095 1.086 1.127 1.083 1.094 1.087performance dividedby ‘Buy and Hold’Standard deviati<strong>on</strong> 0.042 0.041 0.060 0.065 0.042 0.042of meanCorrected standarddeviati<strong>on</strong>0.195 0.190 0.189 0.146 0.191 0.190In Table 7, it can be seen that even <strong>with</strong> just a hundred runs <strong>on</strong> 21 samples <strong>the</strong>standard deviati<strong>on</strong> of <strong>the</strong> mean is about <strong>the</strong> same as that of a thousand runs. I alsoc<strong>on</strong>ducted tests <strong>with</strong> <strong>the</strong> cost of transacti<strong>on</strong> set at 0.12 per cent, <strong>the</strong> same percentageas <strong>the</strong> brokerage of <strong>the</strong> Internet broker Avanza. With a cost of transacti<strong>on</strong> set at 0.05per cent, and still running <strong>the</strong> trading agent a 100 times, <strong>the</strong> agent achieved an averagefinal sum 9.5 per cent higher than that of <strong>the</strong> corresp<strong>on</strong>ding ‘Buy and Hold’ strategy.Translated to a yearly basis that would be 44 per cent. Similarly, <strong>with</strong> a transacti<strong>on</strong>fee of 0.12 per cent, and still a hundred runs, it would amount to 39 per cent. I havenot accounted for <strong>the</strong> margins of error here. I leave that to <strong>the</strong> reader. Also, <strong>on</strong>e mustkeep in mind that <strong>the</strong> agent does not have <strong>the</strong> m<strong>on</strong>ey invested in shares all <strong>the</strong> time.Probably its good performance is, to some extent, due to this fact. It would be17
interesting to see how much time <strong>the</strong> agent keeps its capital invested relative to <strong>the</strong>length of <strong>the</strong> period it is active.I also tested <strong>the</strong> trading agent <strong>on</strong> 5 and 10 samples to see how <strong>the</strong> number ofsamples would affect its results. These tests included <strong>on</strong>ly stocks from <strong>the</strong> OMX-list(most traded stocks <strong>on</strong> <strong>the</strong> <strong>Stock</strong>holm stock market), which makes it a bit devious tocompare <strong>the</strong>ir results <strong>with</strong> <strong>the</strong> results of <strong>the</strong> o<strong>the</strong>r tests. As can be seen, <strong>the</strong>y indicatedthat <strong>the</strong> fewer <strong>the</strong> samples were, <strong>the</strong> greater <strong>the</strong> volatility (standard deviati<strong>on</strong> of mean)would be. It can also be noted that <strong>the</strong> trading agent lost some of its capital in <strong>the</strong> tests<strong>with</strong> 21 samples, but not in those of 5 and 10 samples.5 Discussi<strong>on</strong>There are infinitely many issues to bring up in a discussi<strong>on</strong> as <strong>the</strong> world is mirrored in<strong>the</strong> stock market. Of course, this is an insurmountable task. Never<strong>the</strong>less, <strong>the</strong>re areobvious characteristics and minor details that might be worthwhile c<strong>on</strong>sidering or thatshould be brought up.5.1 Scientific ValidityThere are a few points that I need to add regarding <strong>the</strong> tests and <strong>the</strong> parameters chosenfor <strong>the</strong> artificial agents. When I tested <strong>the</strong> subagent for different pairs of parameters,resulting in charts 2 and 3, I could have chosen to use narrower interval spacing.Instead of 0.01 units between each value I could have used 0.001 units, as even achange of <strong>the</strong> threshold values of this magnitude could make as large a difference to<strong>the</strong> final outcome as leaps of 0.01 units. For <strong>the</strong> tests I c<strong>on</strong>ducted this had nosignificance though, as I was <strong>on</strong>ly looking for <strong>the</strong> general c<strong>on</strong>tours of <strong>the</strong> landscapes,but if a subagent would be put in use it would make a difference, as <strong>the</strong>re would bemore opportunities for both profits and losses.Taking a closer look at <strong>the</strong> plateaux of both <strong>the</strong> period of rising rates and <strong>the</strong>period of falling rates <strong>on</strong>e can see that <strong>the</strong>y do not overlap. Actually, <strong>the</strong> edges of <strong>the</strong>plateaux are adjacent. The borderline is approximately located al<strong>on</strong>g a linecorresp<strong>on</strong>ding to <strong>the</strong> value 0.035 for <strong>the</strong> threshold of purchase. This means that <strong>the</strong>rewere no subagents that could gain m<strong>on</strong>ey both in <strong>the</strong> receding as well as in <strong>the</strong> risingmarket. This suggests that it might not be possible to make a profit <strong>on</strong> this c<strong>on</strong>structal<strong>on</strong>e. Comparing <strong>the</strong> two plateaux, <strong>on</strong>e can also see that in <strong>the</strong> chart of <strong>the</strong> fallingrates (Chart 5), <strong>the</strong> threshold of sale is slightly lower than that of <strong>the</strong> chart of <strong>the</strong>rising rates. For <strong>the</strong> chart of rising rates <strong>the</strong> edge of <strong>the</strong> plateau can be drawn al<strong>on</strong>g <strong>the</strong>line corresp<strong>on</strong>ding to a threshold value of 0 for a sale. For <strong>the</strong> fall of <strong>the</strong> exchange <strong>the</strong>corresp<strong>on</strong>ding value is –0.04. I cannot explain this phenomen<strong>on</strong>. Perhaps, to be ableto earn m<strong>on</strong>ey during a slump, <strong>the</strong>re is a need to hold <strong>on</strong> to stocks, even though <strong>the</strong>yare not doing exceedingly well.Ano<strong>the</strong>r point that merits some menti<strong>on</strong>ing, for <strong>the</strong> sake of future research, istime and <strong>the</strong> possibility for a third parameter. Instead of being fixed, <strong>the</strong> increments oftime could be adjustable, or even dynamic.As a benchmark for <strong>the</strong> tests I ran, I could have chosen to use a ‘Buy and Hold’strategy that sold or bought its stocks when <strong>the</strong> agent did. This would have had <strong>the</strong>advantage of giving a measure of how well <strong>the</strong> stocks <strong>the</strong> agent owned did while in itspossessi<strong>on</strong>. As I have already menti<strong>on</strong>ed above, <strong>with</strong> <strong>the</strong> benchmark strategy I used,<strong>the</strong> agents automatically lost or gained ground relative to <strong>the</strong> ‘Buy and Hold’ strategywhenever <strong>the</strong>y did not own stocks. Still, I needed a Benchmark strategy of this type to18
- Page 1 and 2: Improved P
- Page 3 and 4: mathematical sign that all is not a
- Page 5 and 6: If the model corresponds well with
- Page 7 and 8: this purpose I designed a subagent
- Page 9 and 10: exceeded a threshold value, set bef
- Page 11 and 12: Chart 2, 26 Feb 99 - 25 Feb 00, sam
- Page 13 and 14: Chart 4, Average of 28 samples, 26
- Page 15 and 16: Table 4. The choice of subagent.The
- Page 17: separately (compare with results of
- Page 21 and 22: As I have already indicated in a pr
- Page 23 and 24: [Blume and Easley, 1990] L. Blume,
- Page 25 and 26: B, SHB-ATEL2-B,VOLV-B,WM-B, STE-R,A