Improved Pricing on the Stock Market with Trading Agents
Improved Pricing on the Stock Market with Trading Agents - SAIS
Improved Pricing on the Stock Market with Trading Agents - SAIS

You also want an ePaper? Increase the reach of your titles
YUMPU automatically turns print PDFs into web optimized ePapers that Google loves.
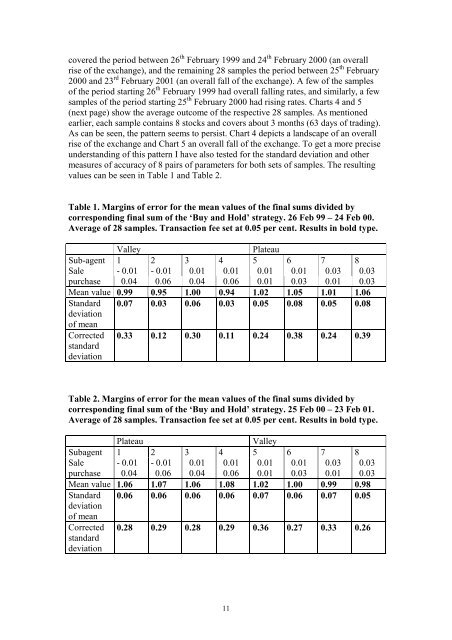
covered <strong>the</strong> period between 26 th February 1999 and 24 th February 2000 (an overallrise of <strong>the</strong> exchange), and <strong>the</strong> remaining 28 samples <strong>the</strong> period between 25 th February2000 and 23 rd February 2001 (an overall fall of <strong>the</strong> exchange). A few of <strong>the</strong> samplesof <strong>the</strong> period starting 26 th February 1999 had overall falling rates, and similarly, a fewsamples of <strong>the</strong> period starting 25 th February 2000 had rising rates. Charts 4 and 5(next page) show <strong>the</strong> average outcome of <strong>the</strong> respective 28 samples. As menti<strong>on</strong>edearlier, each sample c<strong>on</strong>tains 8 stocks and covers about 3 m<strong>on</strong>ths (63 days of trading).As can be seen, <strong>the</strong> pattern seems to persist. Chart 4 depicts a landscape of an overallrise of <strong>the</strong> exchange and Chart 5 an overall fall of <strong>the</strong> exchange. To get a more preciseunderstanding of this pattern I have also tested for <strong>the</strong> standard deviati<strong>on</strong> and o<strong>the</strong>rmeasures of accuracy of 8 pairs of parameters for both sets of samples. The resultingvalues can be seen in Table 1 and Table 2.Table 1. Margins of error for <strong>the</strong> mean values of <strong>the</strong> final sums divided bycorresp<strong>on</strong>ding final sum of <strong>the</strong> ‘Buy and Hold’ strategy. 26 Feb 99 – 24 Feb 00.Average of 28 samples. Transacti<strong>on</strong> fee set at 0.05 per cent. Results in bold type.ValleyPlateauSub-agent 1 2 3 4 5 6 7 8Sale - 0.01 - 0.01 0.01 0.01 0.01 0.01 0.03 0.03purchase 0.04 0.06 0.04 0.06 0.01 0.03 0.01 0.03Mean value 0.99 0.95 1.00 0.94 1.02 1.05 1.01 1.06Standard 0.07 0.03 0.06 0.03 0.05 0.08 0.05 0.08deviati<strong>on</strong>of meanCorrectedstandarddeviati<strong>on</strong>0.33 0.12 0.30 0.11 0.24 0.38 0.24 0.39Table 2. Margins of error for <strong>the</strong> mean values of <strong>the</strong> final sums divided bycorresp<strong>on</strong>ding final sum of <strong>the</strong> ‘Buy and Hold’ strategy. 25 Feb 00 – 23 Feb 01.Average of 28 samples. Transacti<strong>on</strong> fee set at 0.05 per cent. Results in bold type.PlateauValleySubagent 1 2 3 4 5 6 7 8Sale - 0.01 - 0.01 0.01 0.01 0.01 0.01 0.03 0.03purchase 0.04 0.06 0.04 0.06 0.01 0.03 0.01 0.03Mean value 1.06 1.07 1.06 1.08 1.02 1.00 0.99 0.98Standard 0.06 0.06 0.06 0.06 0.07 0.06 0.07 0.05deviati<strong>on</strong>of meanCorrectedstandarddeviati<strong>on</strong>0.28 0.29 0.28 0.29 0.36 0.27 0.33 0.2611