APPLICANT'S UNDERTAKING HOUSING AND URBAN DEVELOPMENT CORPORATION LIMITED
housing and urban development corporation limited - HDFC Bank
housing and urban development corporation limited - HDFC Bank

You also want an ePaper? Increase the reach of your titles
YUMPU automatically turns print PDFs into web optimized ePapers that Google loves.
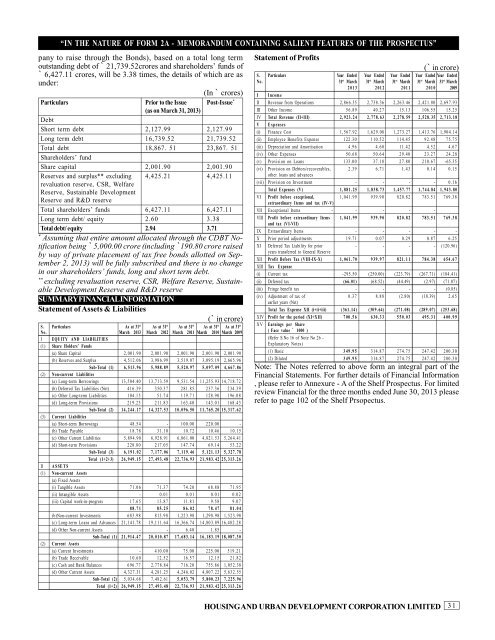
“IN THE NATURE OF FORM 2A - MEMOR<strong>AND</strong>UM CONTAINING SALIENT FEATURES OF THE PROSPECTUS”pany to raise through the Bonds), based on a total long termoutstanding debt of ` 21,739.52crores and shareholders’ funds of` 6,427.11 crores, will be 3.38 times, the details of which are asunder:(In ` crores)Particulars Prior to the Issue Post-Issue *(as on March 31, 2013)DebtShort term debt 2,127.99 2,127.99Long term debt 16,739.52 21,739.52Total debt 18,867. 51 23,867. 51Shareholders’ fundShare capital 2,001.90 2,001.90Reserves and surplus** excluding 4,425.21 4,425.11revaluation reserve, CSR, WelfareReserve, Sustainable DevelopmentReserve and R&D reserveTotal shareholders’ funds 6,427.11 6,427.11Long term debt/ equity 2.60 3.38Total debt/ equity 2.94 3.71*Assuming that entire amount allocated through the CDBT Notificationbeing ` 5,000.00 crore (including `190.80 crore raisedby way of private placement of tax free bonds allotted on September2, 2013) will be fully subscribed and there is no changein our shareholders’ funds, long and short term debt.**excluding revaluation reserve, CSR, Welfare Reserve, SustainableDevelopment Reserve and R&D reserveSUMMARY FINANCIAL INFORMATIONStatement of Assets & Liabilities(` in crore)S . Particulars As at 31 st As at 31 st As at 31 st As at 31 st As at 31 stNo. March 2013 March 2012 March 2011 March 2010 March 2009I EQU ITY <strong>AND</strong> LIAB ILIT IES(1) Share Holders’ Funds(a) Share Capital 2, 00 1. 90 2, 00 1. 90 2, 00 1. 90 2, 00 1. 90 2, 00 1. 90(b) Reserves and Surplus 4, 51 2. 06 3, 98 6. 99 3, 51 9. 07 3, 09 5. 19 2, 66 5. 96Sub-Total (1) 6 , 5 1 3 . 9 6 5 , 9 8 8 . 8 9 5 , 5 2 0 . 9 7 5 , 0 9 7 . 0 9 4 , 6 6 7 . 8 6(2) Non-current L iabilities(a) Long-term Borrowings 13 ,50 4. 40 13 ,71 3. 59 9, 53 1. 54 11 ,25 5. 93 14 ,71 8. 72(b) Deferred Tax Liabilities (Net) 4 16 .3 9 3 50 .3 7 2 81 .8 5 2 37 .3 6 2 34 .3 9(c) Other Long-term Liabilities 1 04 .1 5 5 1. 7 4 1 19 .7 1 1 28 .9 0 1 96 .0 8(d) Long-term Provisions 2 19 .2 3 2 11 .8 3 1 63 .4 0 1 43 .0 1 1 68 .4 3Sub-Total (2) 1 4 , 2 4 4 . 1 7 1 4 , 3 2 7 . 5 3 1 0 , 0 9 6 . 5 0 1 1 , 7 6 5 . 2 0 1 5 , 3 1 7 . 6 2(3) Current Liabilities(a) Short-term Borrowings 4 8. 5 4 - 1 00 .0 0 2 20 .0 0 -(b) Trade Payable 1 8. 7 8 3 1. 1 0 1 0. 7 2 1 0. 4 6 1 0. 1 5(c) Other Current Liabilities 5, 89 4. 90 6, 92 8. 91 6, 86 1. 00 4, 82 1. 53 5, 26 4. 41(d) Short-term Provisions 2 28 .8 0 2 17 .0 5 1 47 .7 4 6 9. 1 4 5 3. 2 2Sub-Total (3) 6 , 1 9 1 . 0 2 7 , 1 7 7 . 0 6 7 , 1 1 9 . 4 6 5 , 1 2 1 . 1 3 5 , 3 2 7 . 7 8Total (1+2+3) 2 6 , 9 4 9 . 1 5 2 7 , 4 9 3 . 4 8 2 2 , 7 3 6 . 9 3 2 1 , 9 8 3 . 4 2 2 5 , 3 1 3 . 2 6II A S SE T S(1) Non-current Assets(a) Fixed Assets(i) Tangible Assets 7 1. 0 6 7 1. 3 7 7 4. 2 0 6 8. 8 8 7 1. 9 5(ii) Intangible Assets - 0 .0 1 0 .0 1 0 .0 1 0 .0 2(iii) Capital work-in-progress 1 7. 6 5 1 3. 8 7 1 1. 8 1 9 .5 8 9 .0 78 8 . 7 1 8 5 . 2 5 8 6 . 0 2 7 8 . 4 7 8 1 . 0 4(b)Non-current Investments 6 83 .9 8 8 13 .9 8 1, 22 3. 98 1, 29 8. 98 1, 52 3. 98(c) Long-term Loans and Advances 21 ,14 1. 78 19 ,11 1. 64 16 ,36 6. 74 14 ,80 3. 89 16 ,48 2. 28(d) Other Non-current Assets - - 6 .4 0 1 .8 5 -Sub-Total (1) 2 1 , 9 1 4 . 4 7 2 0 , 0 1 0 . 8 7 1 7 , 6 8 3 . 1 4 1 6 , 1 8 3 . 1 9 1 8 , 0 8 7 . 3 0(2) Current Assets(a) Current Investments - 4 10 .0 0 7 5. 0 0 2 25 .0 0 5 19 .2 1(b) Trade Receivable 1 0. 6 0 1 2. 5 2 1 6. 5 7 1 2. 1 5 2 1. 8 2(c) Cash and Bank Balances 6 96 .7 7 2, 77 8. 84 7 16 .2 0 7 55 .8 6 1, 05 2. 38(d) Other Current Assets 4, 32 7. 31 4, 28 1. 25 4, 24 6. 02 4, 80 7. 22 5, 63 2. 55Sub-Total (2) 5, 03 4. 68 7, 48 2. 61 5 , 0 5 3 . 7 9 5 , 8 0 0 . 2 3 7 , 2 2 5 . 9 6Total (1+2) 2 6 , 9 4 9 . 1 5 2 7 , 4 9 3 . 4 8 2 2 , 7 3 6 . 9 3 2 1 , 9 8 3 . 4 2 2 5 , 3 1 3 . 2 6Statement of Profits(` in crore)S . Particulars Year Ended Year Ended Year Ended Year Ended Year EndedNo. 31 st March 31 st March 31 st March 31 st March 31 st March2 0 1 3 2 0 1 2 2 0 1 1 2 0 1 0 2009I I nc om eII Revenue from Operations 2, 86 6. 35 2, 73 8. 36 2, 26 3. 46 2, 42 1. 80 2, 69 7. 93III Other Income 5 6. 8 9 4 0. 2 7 1 5. 1 3 1 06 .5 5 1 5. 2 5IV Total R evenue (II+III) 2 , 9 2 3 . 2 4 2 , 7 7 8 . 6 3 2 , 2 7 8 . 5 9 2 , 5 2 8 . 3 5 2 , 7 1 3 . 1 8V E xp en se s(i) Finance Cost 1, 56 7. 92 1, 62 9. 08 1, 27 3. 27 1, 41 3. 76 1, 90 4. 14(ii) Employee Benefits Expense 1 22 .3 0 1 10 .5 2 1 14 .4 5 9 2. 4 8 7 5. 7 5(iii) Depreciation and Amortisation 4 .9 6 4 .6 0 1 1. 4 2 4 .5 2 4 .6 7(iv) Other Expenses 5 0. 6 8 5 0. 6 4 2 9. 4 0 2 3. 2 7 2 4. 2 8(v) Provision on Loans 1 33 .0 0 3 7. 1 8 2 7. 8 0 2 10 .6 7 -65.35(vi) Provision on Debtors/recoverables, 2 .3 9 6 .7 1 1 .4 3 0 .1 4 0 .1 5other loans and advances(vii) Provision on Investment - - - - 0 .1 6Total E xpenses (V) 1 , 8 8 1 . 2 5 1 , 8 3 8 . 7 3 1 , 4 5 7 . 7 7 1 , 7 4 4 . 8 4 1 , 9 4 3 . 8 0VI Profit before exceptional, 1, 04 1. 99 9 39 .9 0 8 20 .8 2 7 83 .5 1 7 69 .3 8extraordinary Items and tax (IV-V)VII Exceptional Items - - - - -VIII Profit before extraordinary Items 1 , 0 4 1 . 9 9 9 3 9 . 9 0 8 2 0 . 8 2 7 8 3 . 5 1 7 6 9 . 3 8and tax (V I-VII)IX Extraordinary Items - - - - -X Prior period adjustments 1 9. 7 1 0 .0 7 0 .2 9 0 .8 7 6 .2 5XI Deferred Tax Liability for prior - - - - (120.96)years transferred to General ReserveXII Profit Before Tax (VIII-IX-X) 1 , 0 6 1 . 7 0 9 3 9 . 9 7 8 2 1 . 1 1 7 8 4 . 3 8 6 5 4 . 6 7XIII Tax Expense(i) Current tax -295.50 (250.00) (223.79) (267.71) (184.41)(ii) Deferred tax (6 6. 01 ) (68.52) (44.49) (2.97) (71.07)(iii) Fringe benefit tax - - - - (0.85)(iv) Adjustment of tax of 0 .3 7 8 .8 8 (2.80) (18.39) 2 .6 5earlier years (Net)Total Tax Expense XII (i+ii+iii) ( 36 1 . 14 ) ( 30 9 . 64 ) ( 27 1 . 08 ) ( 28 9 . 07 ) ( 25 3 . 68 )XIV Profit for the period (XI+X II) 7 0 0 . 5 6 6 3 0 . 3 3 5 5 0 . 0 3 4 9 5 . 3 1 4 0 0 . 9 9X VEarnings per Share( Face value ` 1000 )(Refer S.No 16 of Note No 26 -Explanatory Notes)(1) Basic 3 4 9 . 9 5 3 14 .8 7 2 74 .7 5 2 47 .4 2 2 00 .3 0(2) Diluted 3 4 9 . 9 5 3 14 .8 7 2 74 .7 5 2 47 .4 2 2 00 .3 0Note: The Notes referred to above form an integral part of theFinancial Statements. For further details of Financial Information, please refer to Annexure - A of the Shelf Prospectus. For limitedreview Financial for the three months ended June 30, 2013 pleaserefer to page 102 of the Shelf Prsopectus.<strong>HOUSING</strong> <strong>AND</strong> <strong>URBAN</strong> <strong>DEVELOPMENT</strong> <strong>CORPORATION</strong> <strong>LIMITED</strong>31