ECN 230 The Economics of International Trade
ECN 230 The Economics of International Trade Autumn 2006 - Athene
ECN 230 The Economics of International Trade Autumn 2006 - Athene

You also want an ePaper? Increase the reach of your titles
YUMPU automatically turns print PDFs into web optimized ePapers that Google loves.
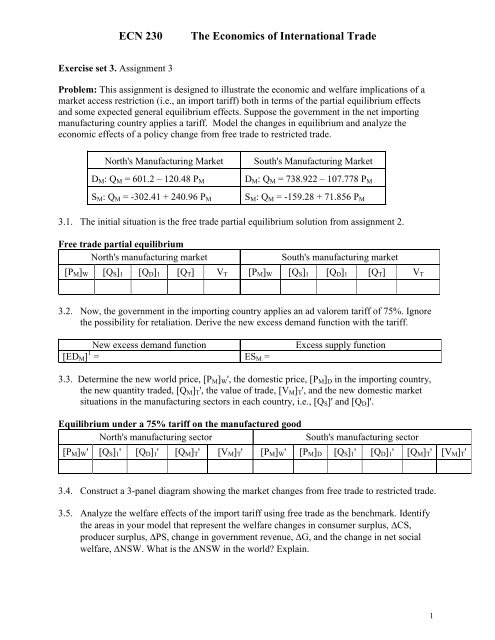
<strong>ECN</strong> <strong>230</strong><strong>The</strong> <strong>Economics</strong> <strong>of</strong> <strong>International</strong> <strong>Trade</strong>Exercise set 3. Assignment 3Problem: This assignment is designed to illustrate the economic and welfare implications <strong>of</strong> amarket access restriction (i.e., an import tariff) both in terms <strong>of</strong> the partial equilibrium effectsand some expected general equilibrium effects. Suppose the government in the net importingmanufacturing country applies a tariff. Model the changes in equilibrium and analyze theeconomic effects <strong>of</strong> a policy change from free trade to restricted trade.North's Manufacturing MarketD M : Q M = 601.2 – 120.48 P MS M : Q M = -302.41 + 240.96 P MSouth's Manufacturing MarketD M : Q M = 738.922 – 107.778 P MS M : Q M = -159.28 + 71.856 P M3.1. <strong>The</strong> initial situation is the free trade partial equilibrium solution from assignment 2.Free trade partial equilibriumNorth's manufacturing marketSouth's manufacturing market[P M ] W [Q S ] 1 [Q D ] 1 [Q T ] V T [P M ] W [Q S ] 1 [Q D ] 1 [Q T ] V T3.2. Now, the government in the importing country applies an ad valorem tariff <strong>of</strong> 75%. Ignorethe possibility for retaliation. Derive the new excess demand function with the tariff.New excess demand function[ED M ] 1 = ES M =Excess supply function3.3. Determine the new world price, [P M ] W ', the domestic price, [P M ] D in the importing country,the new quantity traded, [Q M ] T ', the value <strong>of</strong> trade, [V M ] T ', and the new domestic marketsituations in the manufacturing sectors in each country, i.e., [Q S ]' and [Q D ]'.Equilibrium under a 75% tariff on the manufactured goodNorth's manufacturing sectorSouth's manufacturing sector[P M ] W ' [Q S ] 1 ' [Q D ] 1 ' [Q M ] T ' [V M ] T ' [P M ] W ' [P M ] D [Q S ] 1 ' [Q D ] 1 ' [Q M ] T ' [V M ] T '3.4. Construct a 3-panel diagram showing the market changes from free trade to restricted trade.3.5. Analyze the welfare effects <strong>of</strong> the import tariff using free trade as the benchmark. Identifythe areas in your model that represent the welfare changes in consumer surplus, CS,producer surplus, PS, change in government revenue, G, and the change in net socialwelfare, NSW. What is the NSW in the world? Explain.1
Welfare analysis <strong>of</strong> a tariffWelfare analysisCSPSGNSWImporterExporterChange in NSWin the world3.6. Concepts related to tariffs for class discussion:3.6.1. What is the specific tariff equivalent <strong>of</strong> the ad valorem tariff? That is, what per unittax results in the same economic and welfare effects? What is the quota equivalent <strong>of</strong>the tariff?3.6.2. Is this the maximum revenue-generating tariff? That is, is there a different tariff ratethat generates more revenue for the government?3.6.3. Is this an example <strong>of</strong> an optimal tariff? Explain. What would it mean for the tariff tobe considered a “strategic import policy” on the part <strong>of</strong> the importing government?3.6.4. Would you expect retaliation from the part <strong>of</strong> the exporting country? Explain. Whataction could the exporting country take? Would or could it result in a welfareimprovement in the exporting country?3.7. Recall that each country has an agricultural sector that competes with the manufacturingsector. So, the change in the nominal price <strong>of</strong> the manufactured good, [P M ] W ', will affectthe relative price <strong>of</strong> the goods, [P A ] W /[P M ] W '. You have only solved a partial equilibriumproblem and do not have specific information on how the tariff on the manufactured goodaffects the agricultural sector. However, you can deduce how the trade effect on theinternational manufacturing market affects the relative prices <strong>of</strong> the goods (i.e., P A relativeto P M ) in the markets <strong>of</strong> both economies. To do this, use the <strong>of</strong>fer curve analysis to show:(1) the initial equilibrium <strong>of</strong> quantity traded, [Q A ] T for [Q M ] T , (2) the initial terms <strong>of</strong> trade(TOT), (3) the new equilibrium quantity traded, [Q A ] T ' for [Q M ] T ', and (4) the new terms <strong>of</strong>trade, TOT 1 .Optional: A more advanced general equilibrium solution would be the use <strong>of</strong> the H-O-Sframework. Relying on the use <strong>of</strong> the H-O-S model, show the direction <strong>of</strong> the changes in ageneral equilibrium context as a result <strong>of</strong> the tariff's effect on relative prices, production,consumption, trade and welfare. Do this for each country separately.__________2