Contents
Annual Review 2009 - NASDAQ OMX Armenia
Annual Review 2009 - NASDAQ OMX Armenia
- No tags were found...

You also want an ePaper? Increase the reach of your titles
YUMPU automatically turns print PDFs into web optimized ePapers that Google loves.
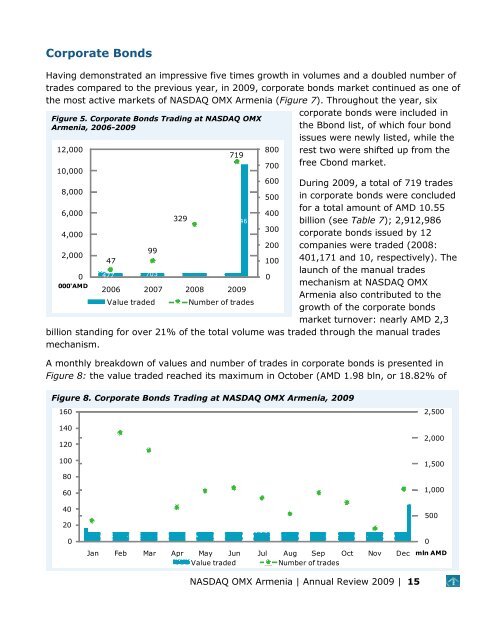
Corporate BondsHaving demonstrated an impressive five times growth in volumes and a doubled number oftrades compared to the previous year, in 2009, corporate bonds market continued as one ofthe most active markets of NASDAQ OMX Armenia (Figure 7). Throughout the year, sixFigure 5. Corporate Bonds Trading at NASDAQ OMXArmenia, 2006-200912,00010,000corporate bonds were included inthe Bbond list, of which four bondissues were newly listed, while therest two were shifted up from thefree Cbond market.8,000600500During 2009, a total of 719 tradesin corporate bonds were concluded6,000for a total amount of AMD 10.5540032910,546billion (see Table 7); 2,912,9864,000300corporate bonds issued by 12200 companies were traded (2008:992,00047100 401,171 and 10, respectively). The2,246launch of the manual trades477 70300000'AMDmechanism at NASDAQ OMX2006 2007 2008 2009Armenia also contributed to theValue traded Number of tradesgrowth of the corporate bondsmarket turnover: nearly AMD 2,3billion standing for over 21% of the total volume was traded through the manual tradesmechanism.A monthly breakdown of values and number of trades in corporate bonds is presented inFigure 8: the value traded reached its maximum in October (AMD 1.98 bln, or 18.82% ofFigure 8. Corporate Bonds Trading at NASDAQ OMX Armenia, 20097198007001601401201008060402002,5002,0001,5001,000Jan Feb Mar Apr May Jun Jul Aug Sep Oct Nov Dec mln AMDValue tradedNumber of trades5000NASDAQ OMX Armenia | Annual Review 2009 | 15