Making a Livable City The Case of Seattle
neighborhood
neighborhood
- No tags were found...

You also want an ePaper? Increase the reach of your titles
YUMPU automatically turns print PDFs into web optimized ePapers that Google loves.
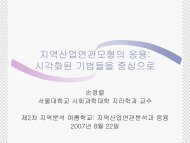
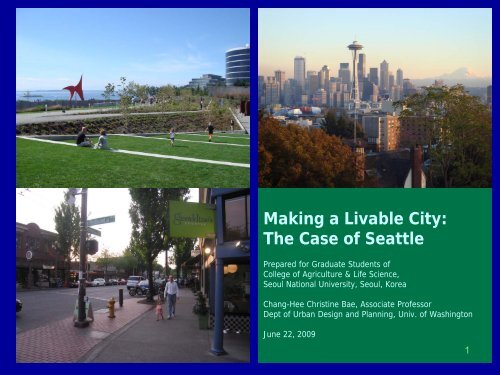
<strong>Making</strong> a <strong>Livable</strong> <strong>City</strong>:<br />
<strong>The</strong> <strong>Case</strong> <strong>of</strong> <strong>Seattle</strong><br />
Prepared for Graduate Students <strong>of</strong><br />
College <strong>of</strong> Agriculture & Life Science,<br />
Seoul National University, Seoul, Korea<br />
Chang-Hee Christine Bae, Associate Pr<strong>of</strong>essor<br />
Dept <strong>of</strong> Urban Design and Planning, Univ. <strong>of</strong> Washington<br />
June 22, 2009<br />
1
SCOPE OF PRESENTATION<br />
• Livability Principles<br />
• <strong>Seattle</strong> Background<br />
• <strong>Seattle</strong> <strong>Case</strong> Studies<br />
• Implications for Korea<br />
• Conclusions
Livability Principles
INTRODUCTION<br />
• Should livability be part <strong>of</strong> a regional<br />
development strategy?<br />
• Yes, because living standards mean not<br />
only jobs and income but also QOL<br />
(quality <strong>of</strong> life) and amenities<br />
• Demand for livability is income-elastic<br />
• Important for attracting migrants and<br />
highly qualified pr<strong>of</strong>essionals (the<br />
“Creative Class”; Rich Florida)
Livability: Historical Context
“LIVABLE CITY” PRINCIPLES<br />
• Implementing livable city projects is easier<br />
in cities that are wealthy and may already<br />
be livable in many dimensions<br />
• <strong>Seattle</strong> is already regarded as one <strong>of</strong> the<br />
most livable cities in the United States<br />
• Major part <strong>of</strong> presentation is visual to<br />
illustrate a few neighborhoods and<br />
projects involving community participation<br />
6
“LIVABLE CITY” PRINCIPLES (cont.)<br />
• Livability is a complicated, multidimensional<br />
concept that has different meanings in different<br />
places<br />
• <strong>The</strong> livable city depends heavily on citizen<br />
perceptions. This implies a need for community<br />
participation<br />
• Some projects are cheap (e.g. those relying on<br />
volunteerism), but others are expensive<br />
7
“LIVABLE CITY” PRINCIPLES (cont.)<br />
• <strong>The</strong> resource constraint problem requires<br />
the involvement <strong>of</strong> government, business<br />
and NGOs as well as the community<br />
• <strong>The</strong> problems are not merely physical, but<br />
also social<br />
• <strong>The</strong> next batch <strong>of</strong> slides present data and<br />
facts about <strong>Seattle</strong><br />
8
JANE JACOBS’ CONTRIBUTION<br />
• Jane Jacobs also made an important link<br />
between livability and urban economic growth:<br />
– Creativity and diversity: “engines” for city growth<br />
– Eclecticism & inventiveness <strong>of</strong> city life<br />
– ‘New Ideas must use old buildings’<br />
• <strong>Livable</strong> cities attract highly qualified and<br />
educated migrants who are conducive to strong<br />
economic growth<br />
9
Goals for Livability and the<br />
Role <strong>of</strong> the Planner in the <strong>Livable</strong> <strong>City</strong><br />
Planning/Livability Goals<br />
• Mobility and Accessibility<br />
• Public Participation<br />
Programs<br />
• Compact Urban Centers<br />
• Economic Vitality<br />
Planners’ Role<br />
• <strong>The</strong> Planner as an Advocate<br />
• Serve as a Resource to<br />
Citizens<br />
• Maintain Balance <strong>of</strong><br />
Livability Elements<br />
• Local Environmental Quality<br />
10
<strong>Seattle</strong> Background
<strong>The</strong> Pacific Northwest and the<br />
“Cascadia” Region<br />
Vancouver:<br />
222 km north<br />
2 million people<br />
(Metro Region)<br />
Portland:<br />
283 km south<br />
1.3 million people<br />
(Metro Region)<br />
12
Growth <strong>of</strong> the Puget Sound Region,<br />
1950-2000<br />
• 1950:<br />
– Washington State:<br />
2.4 million people<br />
– Puget Sound Region:<br />
1.2 million people<br />
• 2000:<br />
– Washington State:<br />
6.3 million people<br />
– Puget Sound Region:<br />
3.5 million people<br />
13
<strong>Seattle</strong> vs. Seoul<br />
Dissimilar<br />
• <strong>Seattle</strong>’s land area is 60% <strong>of</strong> Seoul, but pop is 5.6% <strong>of</strong><br />
Seoul.<br />
– Seoul’s gross pop. density is 10.8 times higher than <strong>Seattle</strong>.<br />
Similar<br />
• GDP/capita is similar, Seoul’s GDP/capita 80% <strong>of</strong><br />
<strong>Seattle</strong><br />
– Seoul: $30510; <strong>Seattle</strong>: $36392<br />
• High housing costs<br />
• Growing income inequality<br />
• Regulatory environment: Urban Growth Areas, Greenbelt<br />
policy<br />
14
<strong>Seattle</strong>: Brief Overview<br />
• <strong>City</strong> is first settled by non-native settlers in 1851<br />
• Economy was originally based upon natural<br />
resources (timber, coal)<br />
• Boeing aircraft became major regional employer<br />
beginning in WWII<br />
• Today:<br />
– High-tech (Micros<strong>of</strong>t: 33,000+ employees in Puget<br />
Sound area)<br />
– Research (Univ. <strong>of</strong> WA: 28,000 faculty & staff)<br />
– Aerospace (Boeing: 69,000 employees in WA)<br />
– Healthcare sector (96,000 jobs in <strong>Seattle</strong>)<br />
15
<strong>Seattle</strong> Demographic Characteristics<br />
(Figures for U.S. shown in parentheses)<br />
• Population: 562,106<br />
• Total Occupied Housing Units: 259,163<br />
• Median household income: $58,311 ($48,451)<br />
• Median owner-occupied home value: $447,800<br />
($185,200)<br />
• Individuals below poverty level: 12.5% (13.3%)<br />
• Adults 25 years+ with 4-year college degree:<br />
53.4% (27%)<br />
• % Foreign Born: 18.8% (12.5%)<br />
16
Relative Size<br />
S. Korea Seoul <strong>City</strong> US WA<br />
<strong>Seattle</strong><br />
<strong>City</strong> Hawaii Honolulu<br />
Area (sq. mi.) 38,492 233.8 288,378 71,342 142.5 10,931 85.7<br />
Pop (million) 49.02 10.3 302.41 5.89 0.582 1.29 0.371<br />
Gross Pop Den (per<br />
sq. mi) 44,055 82.6 4,084 118 4,329<br />
*GDP/capita or<br />
**Med Inc<br />
/capita<br />
(US$,2005) 24,500* 30,510* 25,035** 26,662** 36,392**<br />
25,035<br />
** 27,661**<br />
17
American Style Urban Growth<br />
• Centrifugal Forces<br />
• Centripetal Regulation<br />
Bellevue<br />
Bremerton<br />
S S<br />
e S<br />
e S<br />
a e<br />
a e<br />
t a<br />
t a<br />
t t Tacoma<br />
t t<br />
l t<br />
l t<br />
l<br />
19
Projected Future Growth <strong>of</strong> the<br />
Puget Sound Region<br />
By 2040:<br />
1.6 million more people<br />
1.1 million more jobs<br />
Historic<br />
constant<br />
growth rate<br />
15 year<br />
regional<br />
analysis<br />
National<br />
Econometric<br />
models<br />
WA State Growth Management Act<br />
20
Washington State Growth<br />
Management Act (워싱턴 주 성장관리법)<br />
• Adopted in 1990 to prevent Los Angeles style<br />
sprawl<br />
• Influenced by Oregon State GMA (1973; UGB)<br />
• Allows urban development in designated urban<br />
growth areas<br />
• All cities with rapid growth should have<br />
“Comprehensive Plans” (도시 기본계획) and,<br />
Development Regulations (개발 규제)<br />
– planning via land use regulations key to GMA<br />
implementation<br />
21
Key ideas <strong>of</strong> WA GMA<br />
• Environmentally friendly urban development<br />
• Compact urban development via higher<br />
densities within UGAs<br />
• Preservation <strong>of</strong> agriculture, forest, and other<br />
resource lands<br />
• Reducing automobile dependency via<br />
multimodal transportation<br />
• Coordinating economic development<br />
• Participatory decision making via “early and<br />
continuous citizen participation”<br />
– Neighborhood, city, county, region<br />
22
Foundation <strong>of</strong> GMA implementation:<br />
4Cs<br />
• Comprehensive Plan<br />
• Compact Development<br />
• Concurrency Requirements<br />
• Consistency<br />
23
워싱톤 주 성장관리법: 14 개의 목표<br />
1. 도시 개발은 도시 성장 권역 (UGA) 내에서 유치<br />
2. 도시의 평면적인 확산과 저밀 개발의 지양<br />
3. 다양한 교통수단 장려(multimodal<br />
transportation)<br />
4. 저소득층 주택 보급 (Affordable housing) 장려<br />
5. 경제 개발 장려<br />
6. 사유재산권의 공정한 보상<br />
7. 개발 허가의 적시적이고, 공정한 처리<br />
24
워싱톤 주 성장관리법: 14 개의 목표<br />
8. 자연 자원을 이용한 산업 권장<br />
9. 녹지와 다양한 레크리에이션 기회의 확보<br />
10. 자연 보호와 주(State) 거주민의 삶의 질적 향상<br />
11. 계획 절차상 주민 참여 권장<br />
12. 공공 기관 시설과 서비스 가능성의 확보/권장<br />
13. 역사 보전 지역의 규명과 관리<br />
14. 해안선 관리법 적용<br />
25
Regional Planning (지역 광역 계획)<br />
• Puget Sound Regional Council (퓨젯 사운드 지역 의회):<br />
– 70 cities (시 정부)<br />
– 4 counties (카운티)<br />
– 2 State Agencies<br />
– 7 transit agencies<br />
– tribes<br />
– Long range planning (20년을 내다보는 장기기본성장계획 &<br />
교통계획 수립)<br />
• Vision 2020<br />
• Vision 2040<br />
• Destination 2030<br />
26
<strong>The</strong> Puget Sound Region:<br />
Major Urban Areas<br />
•Puget Sound<br />
4 counties<br />
71 cities<br />
Pop: 3.3 mil<br />
• <strong>Seattle</strong>: 0.55 mil<br />
•UGA adopted in 1990<br />
• Urban lands<br />
• Rural lands<br />
• Resource lands<br />
WRSA 2008 27
25 Urban Growth Centers in the Puget<br />
Sound Region<br />
Map source: PSRC (www.psrc.org)<br />
Urban Growth Area<br />
980 square miles - 16 % <strong>of</strong> total land<br />
area <strong>of</strong> 4-county region<br />
28
Regional Land Uses<br />
Agricultural<br />
• Three (3) land<br />
uses designated<br />
by the GMA:<br />
– Urban Land<br />
– Rural Land<br />
– Resource Land<br />
• Agricultural land<br />
is a “gray area”<br />
29<br />
Map source: PSRC (www.psrc.org)
Salmon(연어) Endangered Species Act,<br />
1999<br />
• Key regional<br />
resource<br />
• “Extinction is<br />
not an option”<br />
• Currently<br />
listed as an<br />
“endangered<br />
species”<br />
(federal)<br />
• Extensive<br />
intergovernmental<br />
cooperation<br />
30<br />
Map source: PSRC (www.psrc.org)
Planning in <strong>Seattle</strong>:<br />
Various Scales <strong>of</strong> Governance<br />
Planning<br />
Framework<br />
<strong>City</strong> Plan<br />
“Bottom-Up”<br />
Neighborhood<br />
Planning<br />
31
<strong>Seattle</strong> Comprehensive Plan<br />
• Titled “Toward a<br />
Sustainable <strong>Seattle</strong>”<br />
• 20 year plan for<br />
residential and<br />
employment growth<br />
• Growth encouraged in<br />
“urban centers” and<br />
“urban villages”<br />
(neighborhoods)<br />
• Includes plans created<br />
by individual<br />
neighborhoods<br />
32
<strong>Seattle</strong>: “A <strong>City</strong> <strong>of</strong> Neighborhoods”<br />
• 13 neighborhood districts<br />
Each district contains several<br />
neighborhoods<br />
• <strong>The</strong> Department <strong>of</strong><br />
Neighborhoods has a staffed<br />
<strong>of</strong>fice in each district<br />
• Many neighborhoods have<br />
created their own local plans<br />
33
Neighborhood-Focused Planning and<br />
Community Involvement<br />
• Neighborhood planning program (1995-1999)<br />
• Neighborhood Matching Fund (Est. 1989)<br />
– $3.2M per year for citizen-led neighborhood<br />
improvement projects<br />
• Many active non-pr<strong>of</strong>it organizations<br />
34<br />
Photo credit: Jim Diers<br />
Photo credit: Jim Diers
• 10 Neighborhoods<br />
• 2024:<br />
– 50,000 new jobs<br />
downtown<br />
– 22,000 new housing<br />
units<br />
• Key themes:<br />
– Affordable housing<br />
– Sustainable building<br />
– Multi-modal<br />
transportation<br />
– Arts & Culture<br />
35
<strong>Seattle</strong>’s Cheonggyecheon?<br />
Existing<br />
waterfront<br />
freeway<br />
Concept plan for<br />
a new waterfront<br />
36<br />
Image source: <strong>Seattle</strong> DPD (http://www.seattle.gov/dpd/Planning/Central_Waterfront/Overview/)
<strong>Seattle</strong> <strong>Case</strong> Studies<br />
38
SEATTLE<br />
• Examples: Queen Anne, Belltown, Columbia<br />
<strong>City</strong>, and Olympic Sculpture Park, Pike Place<br />
Market<br />
• A wealthy city with a few marginal<br />
neighborhoods<br />
• Many community activists<br />
• Already highly regarded nationally as a very<br />
livable city<br />
• High-tech economy results in many wealthy<br />
donors<br />
39
SEATTLE (cont.)<br />
• Queen Anne: high-income neighborhood with<br />
very few problems<br />
• Belltown: rapidly changing neighborhood.<br />
Livability upgrades creating major gentrification<br />
+ conflicts between old and new residents<br />
• Columbia <strong>City</strong>: Recent progress, but community<br />
participation, while longstanding, less visible<br />
than role <strong>of</strong> other stakeholders<br />
40
SEATTLE (cont.)<br />
• Pike Place Market: <strong>Seattle</strong>’s major tourist<br />
attraction saved from threatened<br />
demolition in the 1960s by community and<br />
business action<br />
• Olympic Sculpture Park: Expensive project<br />
with significant private sector financial<br />
support<br />
41
SEATTLE (cont.)<br />
• Conclusions<br />
– Easier to build on an already livable city<br />
– Community participation increases with<br />
neighborhood income<br />
– In marginal neighborhoods, upgrading can<br />
result in adverse distributional impacts via<br />
gentrification<br />
– Emphasis on physical improvements is easier<br />
to justify when poverty is not a major problem<br />
– Livability components can be expensive<br />
42
NEIGHBORHOODS IN SEATTLE<br />
• 37 neighborhoods, 13 neighborhood centers<br />
• Each neighborhood has distinctive<br />
characteristics with its own neighborhood plan:<br />
– Income<br />
– Ethnic and racial mix<br />
– Education levels<br />
– Natural endowments<br />
– Built environmental challenges<br />
43
CITY NEIGHBORHOOD COUNCILS<br />
• Citizen-led advisory groups:<br />
– comprised <strong>of</strong> elected members from each <strong>of</strong> the <strong>City</strong>’s 13<br />
Districts<br />
• organized under the authority <strong>of</strong> <strong>Seattle</strong> <strong>City</strong> Council Resolution<br />
27709 in October, 1987 (1989, 1994)<br />
– Goal: to provide city-wide coordination for the<br />
Neighborhood Matching Fund, Neighborhood Budget<br />
Prioritization, & Neighborhood Planning programs<br />
• (시 전체 지역간 조화를 유지, 근린지구 대응기금, 예산, 계획 달성<br />
사업)<br />
– Monthly meetings are open to public<br />
44
NEIGHBORHOOD PLANNING<br />
• <strong>The</strong>re is no one recipe<br />
• A neighborhood planning process<br />
– provides opportunities for the residents to<br />
enhance their livability based on their own<br />
needs<br />
– helps to articulate visions, goals and<br />
objectives<br />
– guides development and funding priorities<br />
– identifies existing problems<br />
46
NEIGHBORHOOD PLANNING (cont.)<br />
• 1970s: neighborhood improvement programs<br />
started with help from the Community<br />
Development Block Grant program (federal govt<br />
funding)<br />
• 1980s: Department <strong>of</strong> Neighborhoods was<br />
established with Neighborhood Matching Funds<br />
(NMFs)<br />
• 1990s: Neighborhood planning process<br />
consolidated under the WA Growth Management<br />
Act (GMA, *optional element). A comprehensive<br />
plan by city level was mandated. <strong>City</strong> <strong>of</strong> <strong>Seattle</strong><br />
adopted an ‘urban village’ strategy<br />
47
NEIGHBORHOOD PLANNING (cont.)<br />
– Mismatched boundaries in the urban villlage<br />
vs. neighborhood concepts<br />
– <strong>City</strong> met with residents to draw up their own<br />
boundaries for the neighborhood planning<br />
area<br />
– > <strong>City</strong> <strong>of</strong>ficials review the plan<br />
– > Communities prioritize top five projects in<br />
their plans<br />
– > Results submitted to city for funding and<br />
implementation<br />
48
Queen Anne<br />
49
QUEEN ANNE STATISTICS<br />
• Median Household Income: $50,703 (about 42m.<br />
Won)<br />
• % <strong>of</strong> Pop. Living Below Poverty: 6.4%<br />
• % <strong>of</strong> Pop. 16 and Over Unemployed (3.4%)<br />
• Total Number <strong>of</strong> Housing Units: 19,851<br />
• 60% Renters<br />
• Mean Household Size: 1.69 persons<br />
• % Foreign Born: 9.8%<br />
50
Upper QA vs. Lower QA<br />
• A hill divides QA into two neighborhoods:<br />
upper QA & lower QA<br />
• Uptown Neighborhood Park<br />
– Community strives to create neighborhood<br />
amenities<br />
51
Main street in QA: Many Americans prefer to live in small towns.<br />
Upper QA maintains its character <strong>of</strong> old world charm.<br />
54
Counterbalance Park<br />
55
Funding for the Counterbalance Park<br />
project (~40% private contributions)<br />
<strong>Seattle</strong> Pro Parks Levy funding $304,000<br />
Lead gift from Shah Safari, Inc. (Local clothing<br />
company) $225,000<br />
<strong>City</strong> <strong>of</strong> <strong>Seattle</strong>, 2007 Capital Improvement Fund $200,000<br />
<strong>City</strong> <strong>of</strong> <strong>Seattle</strong> Neighborhood Matching Fund<br />
Grant $100,000<br />
Metro/King County Funding $50,000<br />
Grant from the Miller Foundation (used for plant<br />
materials) $45,000<br />
<strong>The</strong> Norcliffe Foundation grant (local private<br />
foundation) $20,000<br />
Safeco Insurance Company grant (<strong>Seattle</strong>-based<br />
company) $10,000<br />
Individual contributions $38,000<br />
Business and corporations $35,500<br />
Total received to date $1,027,500<br />
Keys to project success<br />
1) <strong>City</strong> support through<br />
the neighborhood<br />
planning process<br />
2) Citizen leadership<br />
3) Support by the<br />
Mayor’s Center <strong>City</strong><br />
Parks Initiative.<br />
56
QUEEN ANNE (cont.)<br />
• What makes QA different and livable?<br />
– Location<br />
– Topography<br />
– Socio-economic & demographic composition<br />
– Family friendly neighborhood<br />
– Strong community organizations, e.g. QA Historic<br />
Society<br />
– Proximity to downtown<br />
• Commercial core, walkable from much <strong>of</strong> the neighborhood<br />
• Entertainment core (ballet company, Opera House, <strong>Seattle</strong><br />
Center, Experimental Music Center, and proximity to Pike<br />
Place Market, restaurants, museums, science park, etc.)<br />
• High tech hub (IT, bio tech, etc)<br />
57
QUEEN ANNE (cont.)<br />
• Why is Upper QA<br />
neighborhood so popular?<br />
– Upper QA: historical<br />
neighborhood with<br />
sidewalks, small town<br />
ambience, view <strong>of</strong><br />
downtown & the water,<br />
proximity to downtown,<br />
quality housing on small<br />
lots (3,500 sq. ft. [~325 m 2 ]<br />
lot)<br />
– Success: continues to<br />
attract high income,<br />
educated residents<br />
58
QUEEN ANNE<br />
• Downside <strong>of</strong> Upper QA<br />
– Narrow streets (high auto insurance because<br />
<strong>of</strong> accident rates)<br />
– High house prices<br />
– Difficult terrain in bad weather (especially ice<br />
and snow)<br />
59
Belltown: Efforts to keep its character &<br />
heritage<br />
60
BELLTOWN STATISTICS<br />
• Median Household Income: $31,943<br />
• % <strong>of</strong> Population Living Below Poverty: 20.7%<br />
(highest rate <strong>of</strong> poverty is within the 65-74 yearold<br />
age bracket, with 24% living in poverty)<br />
• Unemployment: 5.3%<br />
• Total Number <strong>of</strong> Housing Units: 6,918<br />
• Renters: Almost 80% <strong>of</strong> households<br />
• Mean Household Size: 1.3 persons<br />
• % Foreign Born: 14.3%<br />
• <strong>The</strong> densest neighborhood in <strong>Seattle</strong><br />
63
BELLTOWN (cont.)<br />
• P-Patch (Cottage Park): open space (in the form<br />
<strong>of</strong> community gardens) created by demolishing<br />
derelict cottages, but preserving 3<br />
• Elite contribution to community building, e.g.<br />
Geiser (architect Growing Vine Street Project),<br />
artists, community activist<br />
• Mixed income community<br />
• Very high density (but not by Seoul standards)<br />
• Close to Downtown<br />
• Traditionally an artist village<br />
64
Cottage Park Project<br />
• 1916: 11 cottages (420 sq.<br />
ft.), 2 on a lot<br />
• 1950: 5 cottages were torn<br />
down (Now, it is the P-Patch<br />
site) + 3 cottages were<br />
removed by Sky Luggage<br />
Company<br />
• Mid-1997: 3 cottages left<br />
• 1998 Plan: Make 3 cottages<br />
habitable for artists, etc.<br />
65
BELLTOWN: P-PATCH<br />
• 6 years collaboration to open the P-Patch<br />
garden<br />
• <strong>City</strong> <strong>of</strong> <strong>Seattle</strong> purchased the site ($3.5 m via the<br />
1989 Open Space Programs Opportunity Fund)<br />
• Opened in 1995: 42 patches (10x10, 5x5)<br />
• Collaborations: <strong>The</strong> Friends <strong>of</strong> Belltown P-<br />
Patch+ <strong>The</strong> Parks Department+ <strong>City</strong>’s P-Patch<br />
Program+Belltown resident volunteers (5,000<br />
total person-hours)<br />
66
GROWING VINE STREET (GVS)<br />
• A runnel: 8 blocks long urban stream<br />
management (8개 블록 연장의 도시하천 수로 관리)<br />
• 1. bi<strong>of</strong>iltration <strong>of</strong> the ro<strong>of</strong> run<strong>of</strong>f (지붕으로부터<br />
오는 우수(빗물)의 자연정화)<br />
• 2. provides green space (녹지공간의 제공)<br />
• 3. introduces the natural hydrologic cycle<br />
(자연적인 물순환체계의 도입)<br />
68
GVS (cont.)<br />
• Treated run<strong>of</strong>f water<br />
will continue its<br />
journey via terraced<br />
water gardens and<br />
reach the ocean<br />
without going through<br />
the <strong>City</strong>’s water<br />
treatment center.<br />
69
GVS: THE BECKONING CISTERN<br />
• Designer: Buster Simpson<br />
• Idea from the Sistine Chapel<br />
70
WHAT MAKES BELLTOWN LIVABLE?<br />
• Tenacity: on-going community participation, especially<br />
since mid-1990s, with strong community leaders and<br />
government, business and NGO support<br />
• Leadership:<br />
– Cottage Park/P-Patch: Glen MacGilvra, Myle Woodwell<br />
– Growing Vine Street: Carolyn Geiser, Buster Simpson<br />
• Community support<br />
– King County, <strong>Seattle</strong> Parks Dept., <strong>Seattle</strong> Foundation, IntraCorp,<br />
Skyway Luggage, Starbucks, RealNetworks, Triad, Ewing &<br />
Clark, the Belltown Business Association and many Belltown<br />
residents<br />
74
BELLTOWN: REFLECTIONS<br />
• Recent growth has been very rapid, but<br />
projects have been on a small scale<br />
• Will it continue to be an artistic community<br />
in the future?<br />
• Potential conflicts between new (gentrified)<br />
and old residents<br />
• Potential obstacle to the level <strong>of</strong><br />
participation: 80% renters (homeowners<br />
are more involved; Fischel)<br />
75
COLUMBIA CITY<br />
• “Just a short drive from downtown <strong>Seattle</strong>,<br />
Columbia <strong>City</strong> is worlds away from<br />
downtown congestion, high rises, and<br />
parking challenges”<br />
http://www.columbiacityseattle.com/<br />
77
MERITS<br />
• Proximity to downtown<br />
• Ethnic and racial diversity<br />
– Diverse restaurants<br />
(Vietnamese pho, Sicilian,<br />
Ethiopian, Mexican, soul food,<br />
etc)<br />
• Organized business<br />
community<br />
– “Beatwalk”<br />
– Farmer’s market<br />
78
FIGHTING BACK FROM DILAPIDATION AND<br />
ECONOMIC STAGNATION<br />
• Better organized business district & <strong>of</strong>ficial<br />
landmark status<br />
• Columbia <strong>City</strong> Development Association (CCDA)<br />
formed in 1976<br />
– Streetscape improvement<br />
– Landmark designation<br />
• South East Effective Development (SEED)<br />
– non-pr<strong>of</strong>it community development organization<br />
– Institutions: Rainier Valley Cultural Center, the<br />
Columbia Hotel, the Columbia <strong>City</strong> Gallery building.<br />
79
GRASSROOTS EFFORTS IN 1990s<br />
• Columbia <strong>City</strong> Revitalization Committee (CCRC)<br />
in 1995<br />
– to protect the business core<br />
– Launched “BeatWalk” & the “ Farmers’ Market”<br />
• <strong>The</strong> Columbia <strong>City</strong> Business Association<br />
(CCBA): Two Organizing Principles<br />
– 1. a pedestrian-friendly, “one-stop shopping district”<br />
that meets the day-to-day needs <strong>of</strong> the surrounding<br />
neighborhood<br />
– 2. a region-wide destination for “dining and<br />
entertainment”<br />
• food, art, entertainment and specialty shops.<br />
80
LANDMARK DISTRICT<br />
A few blocks only<br />
http://www.city<strong>of</strong>seattle.net/neighborhoods/preservation/columbiacity<br />
_map.htm<br />
82
CHARACTERISTICS<br />
• A bohemian community contributing to<br />
<strong>Seattle</strong> as a creative city<br />
• Tenacity: active community organizations<br />
for more than 30 years (however, less<br />
strong than in some other neighborhoods)<br />
83
Pike Place Market<br />
84
PIKE PLACE MARKET<br />
• <strong>Seattle</strong>’s biggest tourist attraction as well<br />
as an active farmers’ market<br />
• Attempts in the 1960s to demolish it and<br />
replace it with large-scale development<br />
• Successful resistance by both market<br />
businesses and community activists<br />
86
Hill & Tower, Los Angeles<br />
www.csulb.edu/~odinthor/socal8.html<br />
Olive Street, Los Angeles (1960)<br />
88
Bunker Hill after Urban Renewal<br />
89
Olympic Sculpture Park<br />
90
OLYMPIC SCULPTURE PARK<br />
• <strong>The</strong> most recent example <strong>of</strong> city-wide<br />
participation on a former 9 acre brownfield<br />
• Total cost = $85 m.<br />
• Stimulus came from private sector art supporters,<br />
architects, and the <strong>Seattle</strong> Art Museum<br />
• Private donations supplemented public funds<br />
• Very expensive art exhibits (e.g. Richard Serra)<br />
• CCTV system to protect against vandalism<br />
91
IMPLICATIONS FOR KOREA: SEOUL<br />
• Resource constraints are a major problem: much easier<br />
to make progress in Seoul than Gwangju<br />
• <strong>The</strong> Cheonggye Cheon project is an example <strong>of</strong> an<br />
expensive project that has more than a marginal impact<br />
and may be justifiable in a very wealthy city, despite<br />
some unaesthetic elements<br />
– A strongly top-down project led by ex-Mayor now President Lee<br />
(part <strong>of</strong> his political campaign)<br />
– Problem is how to achieve urban regeneration in the area as a<br />
whole. <strong>The</strong> restoration area is surrounded by incompatible land<br />
uses and activities<br />
97
Ochi Dong, Gwangju
Ochi Dong, Gwangju<br />
BUK-GU (continued)<br />
• <strong>City</strong>wide problems<br />
– Need for redevelopment (costly)<br />
– Trash<br />
– Traffic and Parking<br />
– Lack <strong>of</strong> support in the business community<br />
– Signage (ubiquitous in Korea? Compare with<br />
US)<br />
99
BUK-GU, Gwangju<br />
• Buk-Gu took a big step towards participatory planning<br />
• <strong>The</strong> projects in Buk-Gu, Gwangju (Ochi and Munhwa<br />
Dongs) are interesting, mainly low-cost except for the<br />
recreational area project in Munhwa, but do they make a<br />
difference?<br />
• <strong>The</strong> arts projects are visually exciting and useful as an<br />
example <strong>of</strong> the community participation process but lack<br />
a broader impact<br />
• <strong>The</strong> recreational area project is non-marginal, but much<br />
more expensive<br />
• In terms <strong>of</strong> the built environment, Gwangju has major<br />
challenges to improve its livability.<br />
100
MUNWA-DONG,<br />
Gwangju
MUNWA-DONG, Gwangju
BUK-GU: CONCLUSIONS<br />
• A few micro-level demonstration projects have<br />
minimal impact on the macro scale<br />
• <strong>Making</strong> a city livable is not always cheap. To<br />
obtain resources and to permit the replication <strong>of</strong><br />
successful projects in other cities/dongs, there is<br />
a need for a combination <strong>of</strong> top-down and<br />
bottom-up planning.<br />
• Community participation is valuable, but it<br />
cannot solve the problem alone<br />
• <strong>The</strong> role <strong>of</strong> the business community is critical<br />
(Example: US concept <strong>of</strong> business improvement<br />
district)<br />
104
OVERALL CONCLUSIONS<br />
• <strong>Seattle</strong> was built upon a firm foundation <strong>of</strong><br />
natural beauty<br />
• Seoul’s livability undermined by the<br />
repercussions <strong>of</strong> rapid economic growth<br />
• Korea’s provincial cities and towns lack the<br />
resources to implement livability projects<br />
• As Korea’s incomes continue to grow, the<br />
demand for QOL and community character will<br />
increase
Thank you!<br />
Please visit me in <strong>Seattle</strong>.<br />
Questions?