to View In Vivo Study - universaldental.com.pk
to View In Vivo Study - universaldental.com.pk
to View In Vivo Study - universaldental.com.pk
- No tags were found...

You also want an ePaper? Increase the reach of your titles
YUMPU automatically turns print PDFs into web optimized ePapers that Google loves.
Manisha Agarwal et al<br />
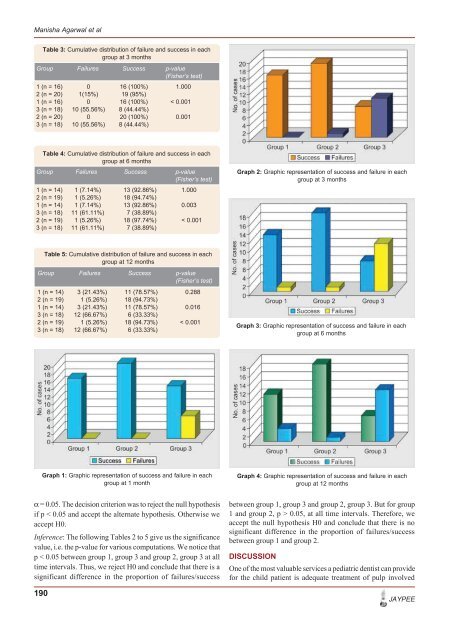
Table 3: Cumulative distribution of failure and success in each<br />
group at 3 months<br />
Group Failures Success p-value<br />
(Fisher’s test)<br />
1 (n = 16) 0 16 (100%) 1.000<br />
2 (n = 20) 1(15%) 19 (95%)<br />
1 (n = 16) 0 16 (100%) < 0.001<br />
3 (n = 18) 10 (55.56%) 8 (44.44%)<br />
2 (n = 20) 0 20 (100%) 0.001<br />
3 (n = 18) 10 (55.56%) 8 (44.44%)<br />
Table 4: Cumulative distribution of failure and success in each<br />
group at 6 months<br />
Group Failures Success p-value<br />
(Fisher’s test)<br />
1 (n = 14) 1 (7.14%) 13 (92.86%) 1.000<br />
2 (n = 19) 1 (5.26%) 18 (94.74%)<br />
1 (n = 14) 1 (7.14%) 13 (92.86%) 0.003<br />
3 (n = 18) 11 (61.11%) 7 (38.89%)<br />
2 (n = 19) 1 (5.26%) 18 (97.74%) < 0.001<br />
3 (n = 18) 11 (61.11%) 7 (38.89%)<br />
Graph 2: Graphic representation of success and failure in each<br />
group at 3 months<br />
Table 5: Cumulative distribution of failure and success in each<br />
group at 12 months<br />
Group Failures Success p-value<br />
(Fisher’s test)<br />
1 (n = 14) 3 (21.43%) 11 (78.57%) 0.288<br />
2 (n = 19) 1 (5.26%) 18 (94.73%)<br />
1 (n = 14) 3 (21.43%) 11 (78.57%) 0.016<br />
3 (n = 18) 12 (66.67%) 6 (33.33%)<br />
2 (n = 19) 1 (5.26%) 18 (94.73%) < 0.001<br />
3 (n = 18) 12 (66.67%) 6 (33.33%)<br />
Graph 3: Graphic representation of success and failure in each<br />
group at 6 months<br />
Graph 1: Graphic representation of success and failure in each<br />
group at 1 month<br />
Graph 4: Graphic representation of success and failure in each<br />
group at 12 months<br />
α = 0.05. The decision criterion was <strong>to</strong> reject the null hypothesis<br />
if p < 0.05 and accept the alternate hypothesis. Otherwise we<br />
accept H0.<br />
<strong>In</strong>ference: The following Tables 2 <strong>to</strong> 5 give us the significance<br />
value, i.e. the p-value for various <strong>com</strong>putations. We notice that<br />
p < 0.05 between group 1, group 3 and group 2, group 3 at all<br />
time intervals. Thus, we reject H0 and conclude that there is a<br />
significant difference in the proportion of failures/success<br />
190<br />
between group 1, group 3 and group 2, group 3. But for group<br />
1 and group 2, p > 0.05, at all time intervals. Therefore, we<br />
accept the null hypothesis H0 and conclude that there is no<br />
significant difference in the proportion of failures/success<br />
between group 1 and group 2.<br />
DISCUSSION<br />
One of the most valuable services a pediatric dentist can provide<br />
for the child patient is adequate treatment of pulp involved<br />
JAYPEE