Equity Emerging Internal Demand Securities Portfolio as at 31/12/12 % of NaV Market Value Quantity % of NaV Market Value Quantity USD USD 751,000 HAITIAN INTERNATIONAL HOLDINGS 896,258 0.29 518,000 CHINA RESOURCES POWER 1,321,927 0.43 449,000 LIFESTYLE INTERNATIONAL HOLDINGS LTD 1,100,656 0.36 728,000 CHINA UNICOM 1,166,553 0.38 99,700 TENCENT HOLDINGS LTD 3,202,921 1.06 636,200 CN TAIPING INSU SHS 1,288,679 0.42 154,698 VINDA INTERNATIONAL HOLDINGS 211,564 0.07 874,000 CNOOC LIMITED 1,892,147 0.62 1,804,000 XINYI GLASS HOLDINGS 1,112,541 0.37 1,240,000 GUANGDONG INVESTMENT LTD 974,295 0.32 Chile 2,957 BANCO SANTANDER-CHILE ADR 13,981 CENCOSUD SA 15,307 CERVECERIAS SP.ADR 1,520,948 CFR PHARMACEUT 3,389,713 84,245 75,789 484,160 384,366 1.11 0.03 0.02 0.16 0.13 130,500 HENGAN INTERNATIONAL GROUP CO LTD 1,278,000 LENOVO GROUP LTD 449,000 SHANGHAI INDUSTRIAL HOLDINGS 172,000 WHARF HOLDINGS Hungary 1,177,741 1,157,496 1,578,572 1,344,784 2,646,972 0.39 0.38 0.52 0.44 0.87 17,920 EDELNOR 42,072 0.01 140,886 OTP BANK 2,646,972 0.87 26,900 EMBOT AND SP ADR-B 19,033 EMPRESA NACIONAL DE TELECOM. 254,992 ENERSIS 8,700 ENERSIS SA ADR 11,362 INVERSIONES LA CONSTRUCTION SA 5,240 LATAM AIRLINES GROUP-SP ADR 124,056 PARAUCO China 1,021,393 393,512 93,636 158,514 221,412 123,454 307,160 17,642,083 0.34 0.13 0.03 0.05 0.07 0.04 0.10 5.79 India 116,959 APOLLO HOSPITALS ENTERPRISE 57,889 BHARAT PETROLEUM CORPORATION LIMITED 50,606 CADILLA HEALTHCARE LTD 145,969 CAIRN INDIA LTD 1,257,000 CITRA MARGA NUSAPHALA 25,711 DR REDDY’S LABORATORIES 20,338 EICHER MOTORS LTD 35,869,724 1,680,738 376,506 833,073 850,131 219,119 858,636 1,078,927 11.77 0.55 0.12 0.27 0.28 0.07 0.28 0.35 689,000 BBMG 625,811 0.21 51,644 FEDERAL BANK LTD 507,297 0.17 1,032,000 BEIJING CAPITAL INTL AIRPORT H 738,966 0.24 440,037 GATEWAY DISTRIPARKS LTD 1,125,190 0.37 813,000 CHINA COMMUNICATIONS CONSTR H 784,592 0.26 10,171 GRASIM INDUSTRIES 588,373 0.19 789,200 CHINA CONSTRUCTION BANK H 633,328 0.21 192,911 HDFC BANK 2,389,293 0.78 318,200 CHINA PACIFIC INSURANCE GR H 1,176,187 0.39 57,668 ICICI BANK 1,198,040 0.39 2,902,000 CHINA PETROLEUM & CHEMICAL H 3,287,332 1.08 303,073 IDFC LTD 947,552 0.31 412,500 CHINA SHENHUA ENERGY CIE LTD 1,806,822 0.59 706,183 ITC LTD 3,696,537 1.22 226,000 FIRST TRACTOR H 221,310 0.07 252,012 JINDAL STEEL & POWER LTD 2,059,930 0.68 287,000 GREAT WALL MOTOR 905,341 0.30 160,954 LIC HOUSING FINANCE LTD 855,885 0.28 1,304,020 INDUSTRIAL & COMMERCIAL BANK OF CHINA-H 925,334 0.30 219,780 LUPIN 2,462,346 0.81 29,500 MINDRAY MEDICAL INTERNATIONAL 964,650 0.32 71,589 MAHINDRA & MAHINDR 1,217,300 0.40 39,900 NW ORIENTL ED & TECHNO GP ADR 775,257 0.25 37,836 MARUTI SUZUKI SHS 1,028,975 0.34 774,000 PETROCHINA CO LTD-H 1,096,465 0.36 185,975 MAX INDIA 820,238 0.27 69,000 PING AN INSURANCE GROUP CO-H 577,757 0.19 178,490 NTPC LTD 509,669 0.17 1,284,000 SHANDONG WEIGAO GROUP MEDICAL 1,277,235 0.42 101,890 PHOENIX MILLS DS 477,743 0.16 486,000 WUMART STORES 1,045,885 0.34 328,362 PRESTIGE ESTATES PROJECTS 1,075,162 0.35 216,000 ZHUZHOU CSR TIMES ELECTRIC CO H 799,811 0.26 153,794 RELIANCE INDUSTRIES LTD 2,356,593 0.77 Colombia 2,500 BANCOLOMBIA ADR 166,450 166,450 0.05 0.05 27,975 STATE BANK OF INDIA 144,764 TATA CHEMICALS DS 250,839 TATA MOTORS 1,218,002 935,325 1,431,371 0.40 0.31 0.47 Czech Republic 13,010 CESKE ENERGETICKE ZAVODY A.S. 1,656 KOMERCNI BANKA AS 949,926 464,770 348,864 0.31 0.16 0.11 116,214 YES BANK 518,230 ZEE ENTERTAINMENT SHS DEMATERIALISED Indonesia 984,287 2,087,486 9,120,119 0.32 0.69 2.99 8,017 TELEFONICA CZECH 136,292 0.04 12,330,000 ACE HARDWARE INDONESIA 1,049,089 0.34 Hong Kong (China) 177,500 BEIJING ENTERPRISE 1,308,000 BRILLIANCE CHINA AUTOMOTIVE 413,000 CHINA EB INTL LTD 102,352 CHINA MERCHANTS HOLDINGS 372,000 CHINA MOBILE LTD 980,000 CHINA OVERSEAS LAND & INVESTMENT LTD 668,250 CHINA OVERS.GRAND OCEANS GROUP 23,261,433 1,156,488 1,609,932 208,876 328,151 4,331,535 2,920,719 803,538 7.63 0.38 0.53 0.07 0.11 1.42 0.96 0.26 2,351,000 ASTRA INTERNATIONAL TBK PT 1,682,500 BANK CENTRAL ASIA 1,027,566 BANK MANDIRI 252,000 GUDANG GARAM 138,500 INDOCEMENT TUNGGAL PRAKARSA TBK PT 1,028,500 MEDIA NUSANTARA CITRA TBK PT 589,500 PT SEMEN GRESIK TBK 1,905,000 RAMAYANA LESTARI 203,500 TAMBANG BATUBARA-B- 1,853,966 1,588,663 863,635 1,472,124 322,628 266,796 969,501 241,152 318,843 0.61 0.52 0.28 0.48 0.11 0.09 0.32 0.08 0.10 The accompanying notes form an integral part of these financial statements 36
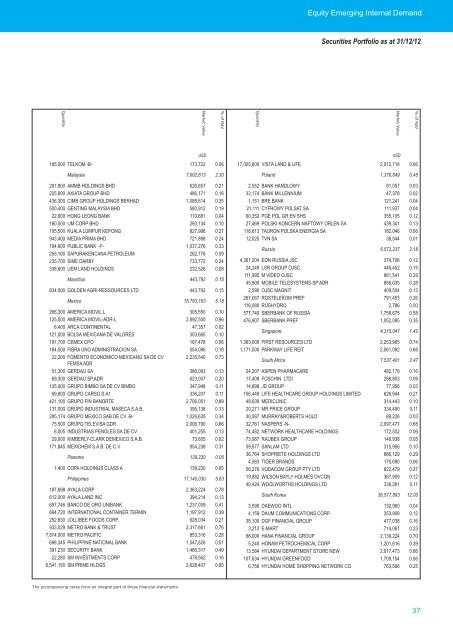
Equity Emerging Internal Demand Securities Portfolio as at 31/12/12 % of NaV Market Value Quantity % of NaV Market Value Quantity USD USD 185,000 TELKOM -B- 173,722 0.06 17,005,600 VISTA LAND & LIFE 2,012,718 0.66 Malaysia 7,002,613 2.30 Poland 1,376,649 0.45 281,900 AMMB HOLDINGS BHD 626,857 0.21 2,552 BANK HANDLOWY 81,057 0.03 225,600 AXIATA GROUP BHD 486,171 0.16 33,174 BANK MILLENNIUM 47,378 0.02 436,300 CIMB GROUP HOLDINGS BERHAD 1,088,614 0.35 1,151 BRE BANK 121,241 0.04 500,400 GENTING MALAYSIA BHD 580,912 0.19 21,111 CYFROWY POLSAT SA 111,937 0.04 22,900 HONG LEONG BANK 110,681 0.04 60,352 PGE POL GR EN SHS 355,105 0.12 180,000 IJM CORP BHD 293,134 0.10 27,469 POLSKI KONCERN NAFTOWY ORLEN SA 439,341 0.13 105,500 KUALA LUMPUR KEPONG 827,996 0.27 118,613 TAURON POLSKA ENERGIA SA 182,046 0.06 943,400 MEDIA PRIMA BHD 721,898 0.24 12,025 TVN SA 38,544 0.01 194,600 PUBLIC BANK -F- 255,100 SAPURAKENCANA PETROLEUM 235,700 SIME DARBY 338,600 UEM LAND HOLDINGS Mauritius 1,037,276 262,776 733,772 232,526 443,792 0.33 0.09 0.24 0.08 0.15 Russia 4,367,204 EON RUSSIA JSC 24,249 LSR GROUP OJSC 111,995 M VIDEO OJSC 45,900 MOBILE TELESYSTEMS-SP ADR 6,573,237 374,706 446,452 881,541 856,035 2.16 0.12 0.15 0.29 0.28 834,000 GOLDEN AGRI-RESSOURCES LTD 443,792 0.15 2,590 OJSC MAGNIT 409,504 0.13 Mexico 266,300 AMERICA MOVIL L 125,000 AMERICA MOVIL-ADR-L 6,400 ARCA CONTINENTAL 121,000 BOLSA MEXICANA DE VALORES 15,783,153 305,550 2,892,500 47,357 303,665 5.18 0.10 0.96 0.02 0.10 267,067 ROSTELEKOM PREF 116,080 RUSHYDRO 577,740 SBERBANK OF RUSSIA 476,907 SBERBANK PREF Singapore 791,453 2,786 1,758,675 1,052,085 4,315,047 0.26 0.00 0.58 0.35 1.42 191,700 CEMEX CPO 187,478 0.06 1,363,000 FIRST RESOURCES LTD 2,253,965 0.74 184,500 FIBRA UNO ADMINISTRACION SA 554,096 0.18 1,171,000 PARKWAY LIFE REIT 2,061,082 0.68 22,200 FOMENTO ECONOMICO MEXICANO SA DE CV FEMSA ADR 2,235,540 0.73 South Africa 7,537,401 2.47 51,300 GERDAU SA 386,093 0.13 24,207 ASPEN PHARMACARE 482,178 0.16 69,300 GERDAU SP.ADR 623,007 0.20 17,409 FOSCHIN LTDI 288,803 0.09 135,000 GRUPO BIMBO SA DE CV BIMBO 347,948 0.11 14,698 JD GROUP 77,956 0.03 69,800 GRUPO CARSO S.A1 336,207 0.11 156,448 LIFE HEALTHCARE GROUP HOLDINGS LIMITED 626,944 0.21 421,100 GRUPO FIN BANORTE 2,706,051 0.89 48,639 MEDICLINIC 314,443 0.10 131,000 GRUPO INDUSTRIAL MASECA S.A.B. 395,138 0.13 20,271 MR PRICE GROUP 334,490 0.11 285,174 GRUPO MEXICO SAB DE CV -B- 1,026,635 0.34 30,587 MURRAY&ROBERTS HOLD 89,226 0.03 75,500 GRUPO TELEVISA GDR 2,006,790 0.66 32,761 NASPERS -N- 2,097,477 0.68 8,005 INDUSTRIAS PENOLES SA DE CV 401,255 0.13 74,482 NETWORK HEALTHCARE HOLDINGS 172,502 0.06 29,000 KIMBERLY-CLARK DEMEXICO S.A.B. 73,605 0.02 73,987 RAUBEX GROUP 146,938 0.05 171,845 MEXICHEM S.A.B. DE C.V 954,238 0.31 59,877 SANLAM LTD 315,956 0.10 Panama 1,400 COPA HOLDINGS CLASS A 139,230 139,230 0.05 0.05 36,764 SHOPRIETE HOLDINGS LTD 4,583 TIGER BRANDS 56,276 VODACOM GROUP PTY LTD 886,129 175,690 822,479 0.29 0.06 0.27 Philippines 187,698 AYALA CORP 612,000 AYALA LAND INC 17,145,030 2,363,224 394,214 5.63 0.78 0.13 19,882 WILSON BAYLY HOLMES OVCON 40,424 WOOLWORTHS HOLDINGS LTD South Korea 367,909 338,281 36,577,893 0.12 0.11 12.00 697,746 BANCO DE ORO UNIBANK 664,720 INTERNATIONAL CONTAINER TERMIN 252,830 JOLLIBEE FOODS CORP. 933,029 METRO BANK & TRUST 7,874,000 METRO PACIFIC 698,345 PHILIPPINE NATIONAL BANK 391,230 SECURITY BANK 22,280 SM INVESTMENTS CORP 6,541,150 SM PRIME HLDGS 1,237,039 1,197,912 628,034 2,317,661 853,316 1,547,626 1,486,317 478,562 2,628,407 0.41 0.39 0.21 0.76 0.28 0.51 0.49 0.16 0.85 3,590 DAEWOO INTL 4,159 DAUM COMMUNICATIONS CORP 35,100 DGF FINANCIAL GROUP 3,212 E-MART 66,000 HANA FINANCIAL GROUP 5,240 HONAM PETROCHEMICAL CORP 13,584 HYUNDAI DEPARTMENT STORE NEW 107,634 HYUNDAI GREENFOOD 6,756 HYUNDAI HOME SHOPPING NETWORK CO 132,960 353,908 477,038 714,061 2,139,224 1,201,616 2,017,473 1,709,154 763,586 0.04 0.12 0.16 0.23 0.70 0.39 0.66 0.56 0.25 The accompanying notes form an integral part of these financial statements 37
- Page 1: AMUNDI FUNDS SICAV with sub-funds u
- Page 5 and 6: Table of Contents Page Organisation
- Page 7 and 8: Organisation CPR Asset Management 9
- Page 9: Equity Euroland Value Portfolios de
- Page 14 and 15: Equity US Concentrated Core Securit
- Page 16 and 17: Equity US Relative Value Securities
- Page 18 and 19: Equity Japan Value Securities Portf
- Page 20 and 21: Equity Euro Select Securities Portf
- Page 22 and 23: Equity Euroland Small Cap Securitie
- Page 24 and 25: Equity Global Luxury and Lifestyle
- Page 26 and 27: Equity Global Resources Securities
- Page 28 and 29: Equity ASEAN Securities Portfolio a
- Page 30 and 31: Equity Asia ex Japan Securities Por
- Page 32 and 33: Equity Brazil Securities Portfolio
- Page 34 and 35: Equity Emerging Europe Securities P
- Page 38 and 39: Equity Emerging Internal Demand Sec
- Page 40 and 41: Equity Emerging World Securities Po
- Page 42 and 43: Equity Emerging World Securities Po
- Page 44 and 45: Equity Emerging World Securities Po
- Page 46 and 47: Equity MENA Securities Portfolio as
- Page 48 and 49: Equity India Securities Portfolio a
- Page 50 and 51: Equity India Infrastructure Securit
- Page 52 and 53: Equity Latin America Securities Por
- Page 54 and 55: Equity Thailand Securities Portfoli
- Page 56 and 57: Equity Europe Minimum Variance Secu
- Page 58 and 59: Equity Global Minimum Variance Secu
- Page 60 and 61: Convertible Europe Securities Portf
- Page 62 and 63: Convertible Global Securities Portf
- Page 64 and 65: Bond Global Corporate Securities Po
- Page 66 and 67: Bond Euro Aggregate Securities Port
- Page 68 and 69: Bond Euro Aggregate Securities Port
- Page 70 and 71: Bond Euro Corporate Securities Port
- Page 72 and 73: Bond Euro Corporate Securities Port
- Page 74 and 75: Bond Euro Inflation Securities Port
- Page 76 and 77: Bond Euro High Yield Securities Por
- Page 78 and 79: Bond US Opportunistic Core Plus Sec
- Page 80 and 81: Bond US Opportunistic Core Plus Sec
- Page 82 and 83: Bond US Opportunistic Core Plus Sec
- Page 84 and 85: Bond Europe Securities Portfolio as
- Page 86 and 87:
Bond Global Aggregate Securities Po
- Page 88 and 89:
Bond Global Aggregate Securities Po
- Page 90 and 91:
Bond Global Securities Portfolio as
- Page 92 and 93:
Bond Emerging Inflation Securities
- Page 94 and 95:
Bond Global Emerging Securities Por
- Page 96 and 97:
Bond Global Emerging Corporate Secu
- Page 98 and 99:
Multi Asset Emerging Markets Securi
- Page 100 and 101:
Multi Asset Emerging Markets Securi
- Page 102 and 103:
Index Equity Euro Securities Portfo
- Page 104 and 105:
Index Equity Europe Securities Port
- Page 106 and 107:
Index Equity Europe Securities Port
- Page 108 and 109:
Index Equity Europe Securities Port
- Page 110 and 111:
Index Equity North America Securiti
- Page 112 and 113:
Index Equity North America Securiti
- Page 114 and 115:
Index Equity North America Securiti
- Page 116 and 117:
Index Equity Pacific Securities Por
- Page 118 and 119:
Index Equity Pacific Securities Por
- Page 120 and 121:
Index Equity Pacific Securities Por
- Page 122 and 123:
Index Global Bond (EUR) Hedged Secu
- Page 124 and 125:
Absolute VaR 2(EUR) Securities Port
- Page 126 and 127:
Absolute VaR 4(EUR) Securities Port
- Page 128 and 129:
Absolute VaR 4(EUR) Securities Port
- Page 130 and 131:
Absolute High Yield Securities Port
- Page 132 and 133:
Absolute Volatility Arbitrage Secur
- Page 134 and 135:
Absolute Volatility Arbitrage Plus
- Page 136 and 137:
Absolute Volatility World Equities
- Page 138 and 139:
Cash EUR Securities Portfolio as at
- Page 140 and 141:
Statement of Net Assets Accounts: N
- Page 142 and 143:
Statement of Net Assets Note Equity
- Page 144 and 145:
Statement of Net Assets Note Equity
- Page 146 and 147:
Statement of Net Assets Note Equity
- Page 148 and 149:
Statement of Net Assets Note Equity
- Page 150 and 151:
Statement of Net Assets Note Equity
- Page 152 and 153:
Statement of Net Assets Note Bond E
- Page 154 and 155:
Statement of Net Assets Note Bond E
- Page 156 and 157:
Statement of Net Assets Note Bond G
- Page 158 and 159:
Statement of Net Assets Note Index
- Page 160 and 161:
Statement of Net Assets Note Absolu
- Page 162:
Statement of Net Assets Note Combin
- Page 165 and 166:
Financial Details Relating to the L
- Page 167 and 168:
Financial Details Relating to the L
- Page 169 and 170:
Financial Details Relating to the L
- Page 171 and 172:
Financial Details Relating to the L
- Page 173 and 174:
Financial Details Relating to the L
- Page 175 and 176:
Financial Details Relating to the L
- Page 177 and 178:
Financial Details Relating to the L
- Page 179 and 180:
Financial Details Relating to the L
- Page 181 and 182:
Financial Details Relating to the L
- Page 183 and 184:
Financial Details Relating to the L
- Page 185 and 186:
Financial Details Relating to the L
- Page 187 and 188:
Financial Details Relating to the L
- Page 189 and 190:
Financial Details Relating to the L
- Page 191 and 192:
Financial Details Relating to the L
- Page 193 and 194:
Financial Details Relating to the L
- Page 195 and 196:
Financial Details Relating to the L
- Page 197 and 198:
Financial Details Relating to the L
- Page 199 and 200:
Financial Details Relating to the L
- Page 201 and 202:
Financial Details Relating to the L
- Page 203 and 204:
Financial Details Relating to the L
- Page 205 and 206:
Financial Details Relating to the L
- Page 207 and 208:
Financial Details Relating to the L
- Page 209 and 210:
Financial Details Relating to the L
- Page 211 and 212:
Financial Details Relating to the L
- Page 213 and 214:
Financial Details Relating to the L
- Page 216 and 217:
Statement of Operations and Changes
- Page 218 and 219:
Statement of Operations and Changes
- Page 220 and 221:
Statement of Operations and Changes
- Page 222 and 223:
Statement of Operations and Changes
- Page 224 and 225:
Statement of Operations and Changes
- Page 226 and 227:
Statement of Operations and Changes
- Page 228 and 229:
Statement of Operations and Changes
- Page 230 and 231:
Statement of Operations and Changes
- Page 232 and 233:
Statement of Operations and Changes
- Page 234 and 235:
Statement of Operations and Changes
- Page 236 and 237:
Statement of Operations and Changes
- Page 238:
Statement of Operations and Changes
- Page 241 and 242:
Notes to the Financial Statements a
- Page 243 and 244:
Notes to the Financial Statements a
- Page 245 and 246:
Notes to the Financial Statements a
- Page 247 and 248:
Notes to the Financial Statements a
- Page 249 and 250:
Notes to the Financial Statements a
- Page 251 and 252:
Notes to the Financial Statements a
- Page 253 and 254:
Notes to the Financial Statements a
- Page 255 and 256:
Notes to the Financial Statements a
- Page 257 and 258:
Notes to the Financial Statements a
- Page 259 and 260:
Notes to the Financial Statements a
- Page 261 and 262:
Notes to the Financial Statements a
- Page 263 and 264:
Notices and Reports If required by
- Page 265 and 266:
Additional Information AMUNDI FUNDS
- Page 267 and 268:
Additional Information AMUNDI FUNDS
- Page 269 and 270:
Additional Information AMUNDI FUNDS
- Page 271 and 272:
Additional Information AMUNDI FUNDS
- Page 274 and 275:
Additional Information HISTORICAL D
- Page 276 and 277:
Additional Information Accounting y
- Page 278 and 279:
Additional Information Accounting y
- Page 280 and 281:
Additional Information Accounting y
- Page 282 and 283:
Additional Information Accounting y
- Page 284 and 285:
Additional Information Accounting y
- Page 286 and 287:
Additional Information Accounting y
- Page 288 and 289:
Additional Information Accounting y
- Page 290 and 291:
Additional Information Accounting y
- Page 292 and 293:
Additional Information Accounting y
- Page 294:
LEGAL NOTICES AMUNDI FUNDS Sociét