Equity Emerging World Securities Portfolio as at 31/12/12 % of NaV Market Value Quantity % of NaV Market Value Quantity USD USD Canada 182,812 PACIFIC RUBIALES 4,243,130 4,243,130 0.37 0.37 423,000 WUMART STORES 1,050,730 ZHUZHOU CSR TIMES ELECTRIC CO H 184,004 ZTE CORP 910,307 3,890,672 310,043 0.08 0.34 0.03 Cayman Islands 36,227,289 3.14 Colombia 552,614 0.05 213,000 AIRTAC INTERNATIONAL GROUP 2,556,877 CHINA RESOURCES LAND LTD 959,000 CHINA SHANSHUI CEMENT GROUP LTD 1,232,274 6,960,554 701,541 0.11 0.60 0.06 8,300 BANCOLOMBIA ADR Czech Republic 552,614 3,354,246 0.05 0.29 7,170,714 COUNTRY GARDEN HOLDINGS CO 3,756,125 0.33 46,321 CESKE ENERGETICKE ZAVODY A.S. 1,654,772 0.14 715,970 ENN ENERGY HOLDINGS LTD 3,117,598 0.27 5,598 KOMERCNI BANKA AS 1,179,312 0.10 733,500 LIFESTYLE INTERNATIONAL HOLDINGS LTD 1,798,064 0.16 30,597 TELEFONICA CZECH 520,162 0.05 271,728 MSTAR SEMICONDUCTOR INC 345,867 TENCENT HOLDINGS LTD 186,000 TPK HOLDING CO LTD 2,039,903 11,111,177 3,285,858 0.18 0.96 0.28 Egypt 14,116 TALAAT MOUSTAFA GROUP 9,826 9,826 0.00 0.00 251,880 VINDA INTERNATIONAL HOLDINGS 3,048,000 XINYI GLASS HOLDINGS Chile 344,470 1,879,725 9,288,673 0.03 0.16 0.80 Hong Kong (China) 475,500 BEIJING ENTERPRISE 2,986,000 BRILLIANCE CHINA AUTOMOTIVE 89,946,574 3,098,086 3,675,274 7.79 0.27 0.32 34,084 ADMT FONDOS PENSIONES PROVIDA 11,948 BANCO SANTANDER-CHILE ADR 116,681 CENCOSUD SA 18,545 CERVECERIAS SP.ADR 4,731,870 CFR PHARMACEUT 68,655 EDELNOR 14,400 EMBOT AND SP ADR-B 65,069 EMBOTELLADORA ANDINA S.A. -B- 210,812 EMBOTELLADORA ANDINA SA PFD A 62,322 EMPRESA NACIONAL DE TELECOM. 1,051,093 ENERSIS 49,700 ENERSIS SA ADR 136,873 HABITAT 29,563 INVERSIONES LA CONSTRUCTION SA 14,180 LATAM AIRLINES GROUP 231,355 340,399 632,509 586,578 1,195,816 161,184 546,768 409,290 1,072,949 1,288,522 385,971 905,534 264,398 576,096 325,496 0.02 0.03 0.05 0.05 0.10 0.01 0.05 0.04 0.09 0.12 0.03 0.08 0.02 0.05 0.03 1,874,000 CHINA EB INTL LTD 940,386 CHINA MERCHANTS HOLDINGS 1,953,345 CHINA MOBILE LTD 3,438,000 CHINA OVERSEAS LAND & INVESTMENT LTD 1,315,250 CHINA OVERS.GRAND OCEANS GROUP 1,639,699 CHINA RESOURCES POWER 2,077,370 CHINA UNICOM 1,866,600 CN TAIPING INSU SHS 3,875,830 CNOOC LIMITED 3,966,000 GUANGDONG INVESTMENT LTD 423,863 HENGAN INTERNATIONAL GROUP CO LTD 4,450,819 LENOVO GROUP LTD 1,139,000 SHANGHAI INDUSTRIAL HOLDINGS 2,735,769 TECHTRONIC INDUSTRIES 627,645 WHARF HOLDINGS 947,779 3,014,978 22,744,568 10,246,354 1,581,524 4,184,485 3,328,795 3,780,963 8,390,893 3,116,173 3,825,294 4,031,147 4,004,440 5,068,570 4,907,251 0.08 0.26 1.96 0.89 0.14 0.36 0.29 0.33 0.73 0.27 0.33 0.35 0.35 0.44 0.42 5,040 LATAM AIRLINES GROUP-SP ADR 99,785 PARAUCO China 118,742 247,066 64,483,792 0.01 0.02 5.58 Hungary 12,568 MOL HUNGARIAN OIL AND GAS PLC 658,060 OTP BANK 14,424,198 1,010,230 12,363,660 1.25 0.09 1.07 328,050 BANK OF COMMUNICATIONS 247,175 0.02 6,407 RICHTER GEDEON PLC 1,050,308 0.09 2,070,500 BBMG 1,968,000 BEIJING CAPITAL INTL AIRPORT H 232,000 CHINA COMMUNICATION SERVI-H 2,894,251 CHINA COMMUNICATIONS CONSTR H 8,815,341 CHINA CONSTRUCTION BANK H 1,144,400 CHINA PACIFIC INSURANCE GR H 10,939,817 CHINA PETROLEUM & CHEMICAL H 1,518,957 CHINA SHENHUA ENERGY CIE LTD 2,911,511 CHINA TELECOM 616,000 FIRST TRACTOR H 939,500 GREAT WALL MOTOR 4,748,660 INDUSTRIAL & COMMERCIAL BANK OF CHINA-H 107,600 MINDRAY MEDICAL INTERNATIONAL 41,330 NW ORIENTL ED & TECHNO GP ADR 3,340,773 PETROCHINA CO LTD-H 237,000 PING AN INSURANCE GROUP CO-H 2,980,000 SHANDONG WEIGAO GROUP MEDICAL 1,880,613 1,409,190 134,097 2,793,118 7,074,260 4,230,133 12,392,420 6,653,295 1,619,002 603,218 2,963,652 3,369,654 3,518,520 803,042 4,732,611 1,984,470 2,964,300 0.16 0.12 0.01 0.24 0.61 0.37 1.07 0.58 0.14 0.05 0.26 0.29 0.30 0.07 0.41 0.17 0.26 India 78,239 BHARAT PETROLEUM CORPORATION LIMITED 29,554 BHARTI AIRTEL LTD 39,269 CADILLA HEALTHCARE LTD 496,275 CAIRN INDIA LTD 83,285 DR REDDY’S LABORATORIES 177,120 FEDERAL BANK LTD 270,592 GATEWAY DISTRIPARKS LTD 426,467 HDFC BANK 121,158 ICICI BANK 780,396 IDFC LTD 272,934 LIC HOUSING FINANCE LTD 280,552 LUPIN 105,142 MARUTI SUZUKI SHS 411,446 NTPC LTD 136,769 RANBAXY LABORATORIES LTD 41,964,831 508,860 171,045 646,444 2,890,333 2,781,360 1,739,842 691,913 5,281,995 2,517,030 2,439,894 1,451,347 3,143,217 2,859,405 1,174,862 1,255,609 3.63 0.04 0.01 0.06 0.25 0.24 0.15 0.06 0.45 0.22 0.21 0.13 0.27 0.25 0.10 0.11 The accompanying notes form an integral part of these financial statements 40
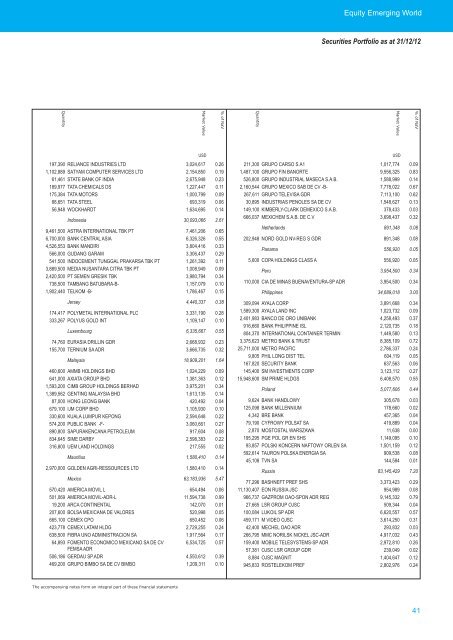
Equity Emerging World Securities Portfolio as at 31/12/12 % of NaV Market Value Quantity % of NaV Market Value Quantity USD USD 197,390 RELIANCE INDUSTRIES LTD 3,024,617 0.26 211,300 GRUPO CARSO S.A1 1,017,774 0.09 1,102,889 SATYAM COMPUTER SERVICES LTD 2,154,850 0.19 1,487,100 GRUPO FIN BANORTE 9,556,325 0.83 61,461 STATE BANK OF INDIA 2,675,948 0.23 526,800 GRUPO INDUSTRIAL MASECA S.A.B. 1,588,999 0.14 189,977 TATA CHEMICALS DS 1,227,447 0.11 2,160,544 GRUPO MEXICO SAB DE CV -B- 7,778,022 0.67 175,384 TATA MOTORS 1,000,799 0.09 267,611 GRUPO TELEVISA GDR 7,113,100 0.62 88,651 TATA STEEL 693,319 0.06 30,895 INDUSTRIAS PENOLES SA DE CV 1,548,627 0.13 56,948 WOCKHARDT 1,634,695 0.14 149,100 KIMBERLY-CLARK DEMEXICO S.A.B. 378,433 0.03 Indonesia 30,093,066 2.61 666,037 MEXICHEM S.A.B. DE C.V 3,698,437 0.32 9,461,500 ASTRA INTERNATIONAL TBK PT 7,461,206 0.65 Netherlands 891,348 0.08 6,700,000 BANK CENTRAL ASIA 6,326,326 0.55 202,948 NORD GOLD NV-REG S GDR 891,348 0.08 4,526,553 BANK MANDIRI 566,000 GUDANG GARAM 541,500 INDOCEMENT TUNGGAL PRAKARSA TBK PT 3,804,416 3,306,437 1,261,392 0.33 0.29 0.11 Panama 5,600 COPA HOLDINGS CLASS A 556,920 556,920 0.05 0.05 3,889,500 MEDIA NUSANTARA CITRA TBK PT 2,420,500 PT SEMEN GRESIK TBK 738,500 TAMBANG BATUBARA-B- 1,008,949 3,980,794 1,157,079 0.09 0.34 0.10 Peru 110,000 CIA DE MINAS BUENAVENTURA-SP ADR 3,954,500 3,954,500 0.34 0.34 1,902,440 TELKOM -B- 1,786,467 0.15 Philippines 34,689,018 3.00 Jersey 4,440,337 0.38 309,094 AYALA CORP 3,891,668 0.34 174,417 POLYMETAL INTERNATIONAL PLC 333,267 POLYUS GOLD INT Luxembourg 3,331,190 1,109,147 6,335,667 0.28 0.10 0.55 1,589,300 AYALA LAND INC 2,401,983 BANCO DE ORO UNIBANK 916,660 BANK PHILIPPINE ISL 804,370 INTERNATIONAL CONTAINER TERMIN 1,023,732 4,258,493 2,120,735 1,449,580 0.09 0.37 0.18 0.13 74,760 EURASIA DRILLIN GDR 155,700 TERNIUM SA ADR Malaysia 2,668,932 3,666,735 18,909,201 0.23 0.32 1.64 3,375,623 METRO BANK & TRUST 25,711,000 METRO PACIFIC 9,805 PHIL LONG DIST TEL 167,820 SECURITY BANK 8,385,109 2,786,337 604,119 637,563 0.72 0.24 0.05 0.06 460,600 AMMB HOLDINGS BHD 1,024,229 0.09 145,400 SM INVESTMENTS CORP 3,123,112 0.27 641,000 AXIATA GROUP BHD 1,381,363 0.12 15,948,600 SM PRIME HLDGS 6,408,570 0.55 1,593,200 CIMB GROUP HOLDINGS BERHAD 1,389,562 GENTING MALAYSIA BHD 87,000 HONG LEONG BANK 679,100 IJM CORP BHD 330,600 KUALA LUMPUR KEPONG 574,200 PUBLIC BANK -F- 890,800 SAPURAKENCANA PETROLEUM 834,645 SIME DARBY 316,800 UEM LAND HOLDINGS Mauritius 3,975,201 1,613,135 420,492 1,105,930 2,594,648 3,060,661 917,604 2,598,383 217,555 1,580,410 0.34 0.14 0.04 0.10 0.22 0.27 0.08 0.22 0.02 0.14 Poland 9,624 BANK HANDLOWY 125,098 BANK MILLENNIUM 4,342 BRE BANK 79,190 CYFROWY POLSAT SA 2,870 MOSTOSTAL WARSZAWA 195,295 PGE POL GR EN SHS 93,857 POLSKI KONCERN NAFTOWY ORLEN SA 592,614 TAURON POLSKA ENERGIA SA 45,108 TVN SA 5,077,606 305,678 178,660 457,365 419,889 11,638 1,149,095 1,501,159 909,538 144,584 0.44 0.03 0.02 0.04 0.04 0.00 0.10 0.12 0.08 0.01 2,970,000 GOLDEN AGRI-RESSOURCES LTD 1,580,410 0.14 Russia 83,145,429 7.20 Mexico 63,183,936 5.47 77,296 BASHNEFT PREF SHS 3,373,423 0.29 570,420 AMERICA MOVIL L 654,494 0.06 11,130,407 EON RUSSIA JSC 954,989 0.08 501,069 AMERICA MOVIL-ADR-L 11,594,738 0.99 966,737 GAZPROM OAO-SPON ADR REG 9,145,332 0.79 19,200 ARCA CONTINENTAL 142,070 0.01 27,665 LSR GROUP OJSC 509,344 0.04 207,600 BOLSA MEXICANA DE VALORES 520,998 0.05 100,084 LUKOIL SP ADR 6,620,557 0.57 665,100 CEMEX CPO 650,452 0.06 459,171 M VIDEO OJSC 3,614,250 0.31 423,778 CEMEX LATAM HLDG 2,729,255 0.24 42,400 MECHEL OAO ADR 293,832 0.03 638,500 FIBRA UNO ADMINISTRACION SA 1,917,564 0.17 266,795 MMC NORILSK NICKEL JSC-ADR 4,917,032 0.43 64,893 FOMENTO ECONOMICO MEXICANO SA DE CV FEMSA ADR 506,186 GERDAU SP.ADR 469,200 GRUPO BIMBO SA DE CV BIMBO 6,534,725 4,550,612 1,209,311 0.57 0.39 0.10 159,400 MOBILE TELESYSTEMS-SP ADR 57,381 OJSC LSR GROUP GDR 8,884 OJSC MAGNIT 945,833 ROSTELEKOM PREF 2,972,810 239,049 1,404,647 2,802,976 0.26 0.02 0.12 0.24 The accompanying notes form an integral part of these financial statements 41
- Page 1: AMUNDI FUNDS SICAV with sub-funds u
- Page 5 and 6: Table of Contents Page Organisation
- Page 7 and 8: Organisation CPR Asset Management 9
- Page 9: Equity Euroland Value Portfolios de
- Page 14 and 15: Equity US Concentrated Core Securit
- Page 16 and 17: Equity US Relative Value Securities
- Page 18 and 19: Equity Japan Value Securities Portf
- Page 20 and 21: Equity Euro Select Securities Portf
- Page 22 and 23: Equity Euroland Small Cap Securitie
- Page 24 and 25: Equity Global Luxury and Lifestyle
- Page 26 and 27: Equity Global Resources Securities
- Page 28 and 29: Equity ASEAN Securities Portfolio a
- Page 30 and 31: Equity Asia ex Japan Securities Por
- Page 32 and 33: Equity Brazil Securities Portfolio
- Page 34 and 35: Equity Emerging Europe Securities P
- Page 36 and 37: Equity Emerging Internal Demand Sec
- Page 38 and 39: Equity Emerging Internal Demand Sec
- Page 42 and 43: Equity Emerging World Securities Po
- Page 44 and 45: Equity Emerging World Securities Po
- Page 46 and 47: Equity MENA Securities Portfolio as
- Page 48 and 49: Equity India Securities Portfolio a
- Page 50 and 51: Equity India Infrastructure Securit
- Page 52 and 53: Equity Latin America Securities Por
- Page 54 and 55: Equity Thailand Securities Portfoli
- Page 56 and 57: Equity Europe Minimum Variance Secu
- Page 58 and 59: Equity Global Minimum Variance Secu
- Page 60 and 61: Convertible Europe Securities Portf
- Page 62 and 63: Convertible Global Securities Portf
- Page 64 and 65: Bond Global Corporate Securities Po
- Page 66 and 67: Bond Euro Aggregate Securities Port
- Page 68 and 69: Bond Euro Aggregate Securities Port
- Page 70 and 71: Bond Euro Corporate Securities Port
- Page 72 and 73: Bond Euro Corporate Securities Port
- Page 74 and 75: Bond Euro Inflation Securities Port
- Page 76 and 77: Bond Euro High Yield Securities Por
- Page 78 and 79: Bond US Opportunistic Core Plus Sec
- Page 80 and 81: Bond US Opportunistic Core Plus Sec
- Page 82 and 83: Bond US Opportunistic Core Plus Sec
- Page 84 and 85: Bond Europe Securities Portfolio as
- Page 86 and 87: Bond Global Aggregate Securities Po
- Page 88 and 89: Bond Global Aggregate Securities Po
- Page 90 and 91:
Bond Global Securities Portfolio as
- Page 92 and 93:
Bond Emerging Inflation Securities
- Page 94 and 95:
Bond Global Emerging Securities Por
- Page 96 and 97:
Bond Global Emerging Corporate Secu
- Page 98 and 99:
Multi Asset Emerging Markets Securi
- Page 100 and 101:
Multi Asset Emerging Markets Securi
- Page 102 and 103:
Index Equity Euro Securities Portfo
- Page 104 and 105:
Index Equity Europe Securities Port
- Page 106 and 107:
Index Equity Europe Securities Port
- Page 108 and 109:
Index Equity Europe Securities Port
- Page 110 and 111:
Index Equity North America Securiti
- Page 112 and 113:
Index Equity North America Securiti
- Page 114 and 115:
Index Equity North America Securiti
- Page 116 and 117:
Index Equity Pacific Securities Por
- Page 118 and 119:
Index Equity Pacific Securities Por
- Page 120 and 121:
Index Equity Pacific Securities Por
- Page 122 and 123:
Index Global Bond (EUR) Hedged Secu
- Page 124 and 125:
Absolute VaR 2(EUR) Securities Port
- Page 126 and 127:
Absolute VaR 4(EUR) Securities Port
- Page 128 and 129:
Absolute VaR 4(EUR) Securities Port
- Page 130 and 131:
Absolute High Yield Securities Port
- Page 132 and 133:
Absolute Volatility Arbitrage Secur
- Page 134 and 135:
Absolute Volatility Arbitrage Plus
- Page 136 and 137:
Absolute Volatility World Equities
- Page 138 and 139:
Cash EUR Securities Portfolio as at
- Page 140 and 141:
Statement of Net Assets Accounts: N
- Page 142 and 143:
Statement of Net Assets Note Equity
- Page 144 and 145:
Statement of Net Assets Note Equity
- Page 146 and 147:
Statement of Net Assets Note Equity
- Page 148 and 149:
Statement of Net Assets Note Equity
- Page 150 and 151:
Statement of Net Assets Note Equity
- Page 152 and 153:
Statement of Net Assets Note Bond E
- Page 154 and 155:
Statement of Net Assets Note Bond E
- Page 156 and 157:
Statement of Net Assets Note Bond G
- Page 158 and 159:
Statement of Net Assets Note Index
- Page 160 and 161:
Statement of Net Assets Note Absolu
- Page 162:
Statement of Net Assets Note Combin
- Page 165 and 166:
Financial Details Relating to the L
- Page 167 and 168:
Financial Details Relating to the L
- Page 169 and 170:
Financial Details Relating to the L
- Page 171 and 172:
Financial Details Relating to the L
- Page 173 and 174:
Financial Details Relating to the L
- Page 175 and 176:
Financial Details Relating to the L
- Page 177 and 178:
Financial Details Relating to the L
- Page 179 and 180:
Financial Details Relating to the L
- Page 181 and 182:
Financial Details Relating to the L
- Page 183 and 184:
Financial Details Relating to the L
- Page 185 and 186:
Financial Details Relating to the L
- Page 187 and 188:
Financial Details Relating to the L
- Page 189 and 190:
Financial Details Relating to the L
- Page 191 and 192:
Financial Details Relating to the L
- Page 193 and 194:
Financial Details Relating to the L
- Page 195 and 196:
Financial Details Relating to the L
- Page 197 and 198:
Financial Details Relating to the L
- Page 199 and 200:
Financial Details Relating to the L
- Page 201 and 202:
Financial Details Relating to the L
- Page 203 and 204:
Financial Details Relating to the L
- Page 205 and 206:
Financial Details Relating to the L
- Page 207 and 208:
Financial Details Relating to the L
- Page 209 and 210:
Financial Details Relating to the L
- Page 211 and 212:
Financial Details Relating to the L
- Page 213 and 214:
Financial Details Relating to the L
- Page 216 and 217:
Statement of Operations and Changes
- Page 218 and 219:
Statement of Operations and Changes
- Page 220 and 221:
Statement of Operations and Changes
- Page 222 and 223:
Statement of Operations and Changes
- Page 224 and 225:
Statement of Operations and Changes
- Page 226 and 227:
Statement of Operations and Changes
- Page 228 and 229:
Statement of Operations and Changes
- Page 230 and 231:
Statement of Operations and Changes
- Page 232 and 233:
Statement of Operations and Changes
- Page 234 and 235:
Statement of Operations and Changes
- Page 236 and 237:
Statement of Operations and Changes
- Page 238:
Statement of Operations and Changes
- Page 241 and 242:
Notes to the Financial Statements a
- Page 243 and 244:
Notes to the Financial Statements a
- Page 245 and 246:
Notes to the Financial Statements a
- Page 247 and 248:
Notes to the Financial Statements a
- Page 249 and 250:
Notes to the Financial Statements a
- Page 251 and 252:
Notes to the Financial Statements a
- Page 253 and 254:
Notes to the Financial Statements a
- Page 255 and 256:
Notes to the Financial Statements a
- Page 257 and 258:
Notes to the Financial Statements a
- Page 259 and 260:
Notes to the Financial Statements a
- Page 261 and 262:
Notes to the Financial Statements a
- Page 263 and 264:
Notices and Reports If required by
- Page 265 and 266:
Additional Information AMUNDI FUNDS
- Page 267 and 268:
Additional Information AMUNDI FUNDS
- Page 269 and 270:
Additional Information AMUNDI FUNDS
- Page 271 and 272:
Additional Information AMUNDI FUNDS
- Page 274 and 275:
Additional Information HISTORICAL D
- Page 276 and 277:
Additional Information Accounting y
- Page 278 and 279:
Additional Information Accounting y
- Page 280 and 281:
Additional Information Accounting y
- Page 282 and 283:
Additional Information Accounting y
- Page 284 and 285:
Additional Information Accounting y
- Page 286 and 287:
Additional Information Accounting y
- Page 288 and 289:
Additional Information Accounting y
- Page 290 and 291:
Additional Information Accounting y
- Page 292 and 293:
Additional Information Accounting y
- Page 294:
LEGAL NOTICES AMUNDI FUNDS Sociét