global social media users visited the site during the month. Time spent on Facebook has also increased, with global users spending nearly six hours per month on the site. While some organisations may remain skeptical about the ability to use social media to drive transaction revenues, maintaining and monitoring a brand presence wherever consumers choose to discuss travel has important value. Word of mouth has tremendous power in consumer travel decisions, and social media applications like Twitter allow companies to essentially “eavesdrop” on conversations and interact with consumers directly. The value of social networks for public relations and customer service are reason enough to build a branded presence in popular networks. Interaction with consumers outside of a website adds a new facet to brand identity to allow a company to become more than just a URL, and drives new touch points and higher levels of engagement. 10 Germany 2010
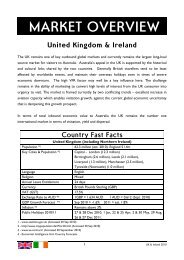
ARRIVALS TO VICTORIA & AUSTRALIA Arrivals from Germany have been constant over the last few years – despite the global recession. For Germans, travelling is an essential part of their lives and they would rather save their spending on clothes and consumer goods than on travel. It is no surprise that Germany is the biggest outbound travel market in Europe. However, only 7% of all German travels are long haul - the majority of trips stay within Germany or Europe. For the year ending June 2010 Australia showed a slight increase in visitor numbers whereas German visitors to Victoria have decreased by 4 percent. Germany Visitors Y/E June 1994 1995 1996 1997 1998 1999 2000 2001 2002 2003 2004 2005 2006 2007 2008 2009 2010 AAG % change Complete 09/10 Australia 111,619 113,278 118,128 122,174 125,216 125,596 142,900 142,920 131,959 130,161 136,642 137,889 145,188 143,614 149,689 153,264 157,818 2% 3% New South Wales 80,859 83,928 89,526 85,490 91,741 90,427 97,804 96,289 97,647 92,171 92,434 96,815 97,529 99,569 105,974 104,923 107,777 2% 3% Queensland 67,981 63,032 65,767 68,206 75,258 69,646 74,646 71,358 78,284 64,615 70,852 71,802 75,931 74,851 73,617 79,625 81,291 1% 2% Victoria 44,488 53,047 48,849 51,064 53,814 46,588 53,819 55,302 54,371 51,196 54,033 55,518 57,330 55,272 62,893 60,312 58,043 2% -4% Victoria Mkt Share 40% 47% 41% 42% 43% 37% 38% 39% 41% 39% 40% 40% 39% 38% 42% 39% 37% Source: International Visitor Survey 1994-2010, Tourism Research Australia Visitors 175,000 50% 150,000 45% 40% 125,000 35% Visitors 100,000 75,000 30% 25% 20% Market Share 50,000 15% 10% 25,000 5% 0 0% 1994 1995 1996 1997 1998 1999 2000 2001 2002 2003 2004 2005 2006 2007 2008 2009 2010 Year Ending June Australia New South Wales Queensland Victoria Victoria Mkt Share Visitor Forecasts 2019 Places Visited - Overnight Visit or Daytrip (% of all Visitors to Victoria) Australia 201,129 Great Ocean Road 59% Victoria 76,061 Phillip Island, penguin parade 29% Ballarat, Sovereign Hill 13% Yarra Valley 12% Source: Tourism Forecasting Committee, Forecast 2010 Issue 1, Tourism Research Dandenongs, Puffing Billy, Healesville 12% Australia, Canberra. Mornington Peninsula 10% (Tourism Victoria estimates for Visitor Source: International Visitor Survey, Tourism Research Australia (year ending December 2009) Forecasts 2019 based on Year Ending December 2009 International Visitor Survey data). 11 Germany 2010