THE Q-HOMOTOPY ANALYSIS METHOD (Q-HAM) - IJAMM
THE Q-HOMOTOPY ANALYSIS METHOD (Q-HAM) - IJAMM
THE Q-HOMOTOPY ANALYSIS METHOD (Q-HAM) - IJAMM

Create successful ePaper yourself
Turn your PDF publications into a flip-book with our unique Google optimized e-Paper software.
68<br />
Int. J. of Appl. Math and Mech. 8 (15): 51-75, 2012.<br />
M. A. El-Tawil and S. N. Huseen<br />
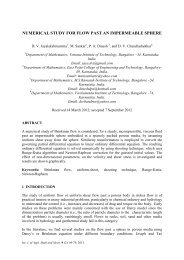
To find the valid region of ,the -curves given by the 10 th order q-<strong>HAM</strong> approximation at<br />
different values of are drawn in figures (19 ,20 and 21).This figures show the<br />
interval of where the value of is constant at certain . We choose the<br />
horizontal line parallel to as a valid region which provides us with a simple way<br />
to adjust and control the convergence region.<br />
5 10 14<br />
4 10 14<br />
3 10 14<br />
2 10 14<br />
1 10 14<br />
U 10 , n<br />
0.06 0.04 0.02 0.02 0.04 0.06<br />
Figure : - curves for the <strong>HAM</strong> (q-<strong>HAM</strong>; approximation solution of<br />
problem (1) at different values of .<br />
U 10 , n<br />
2000<br />
1500<br />
1000<br />
500<br />
0.06 0.04 0.02 0.02<br />
Figure : - curves for the q-<strong>HAM</strong>( approximation solution of<br />
problem (1) at different values of .<br />
h<br />
h<br />
U 10 0.1 ,1<br />
U 10 0.6 ,1<br />
U 10 1,1<br />
U 10 2,1<br />
U 10 0.1 ,10<br />
U 10 0.6 ,10<br />
U 10 1,10<br />
U 10 2,10