

Technologies to Reduce or Capture and Store Carbon Dioxide Emissions
TECHNOLOgIEs to Reduce or Capture and store Carbon Dioxide ...
TECHNOLOgIEs to Reduce or Capture and store Carbon Dioxide ...

Create successful ePaper yourself
Turn your PDF publications into a flip-book with our unique Google optimized e-Paper software.
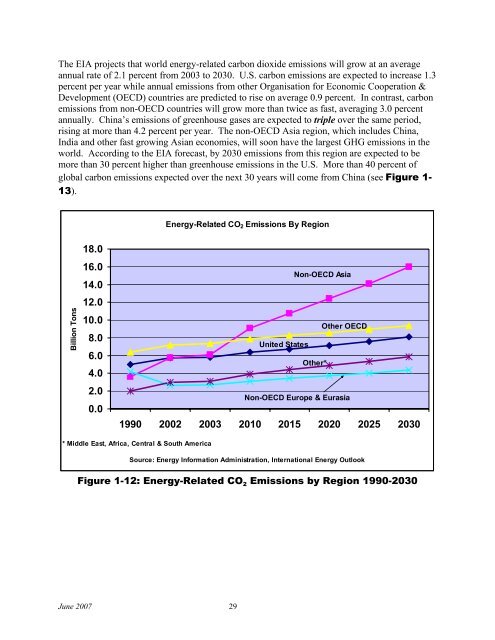
The EIA projects that w<strong>or</strong>ld energy-related carbon dioxide emissions will grow at an average<br />
annual rate of 2.1 percent from 2003 <strong>to</strong> 2030. U.S. carbon emissions are expected <strong>to</strong> increase 1.3<br />
percent per year while annual emissions from other Organisation f<strong>or</strong> Economic Cooperation &<br />
Development (OECD) countries are predicted <strong>to</strong> rise on average 0.9 percent. In contrast, carbon<br />
emissions from non-OECD countries will grow m<strong>or</strong>e than twice as fast, averaging 3.0 percent<br />
annually. China’s emissions of greenhouse gases are expected <strong>to</strong> triple over the same period,<br />
rising at m<strong>or</strong>e than 4.2 percent per year. The non-OECD Asia region, which includes China,<br />
India <strong>and</strong> other fast growing Asian economies, will soon have the largest GHG emissions in the<br />
w<strong>or</strong>ld. Acc<strong>or</strong>ding <strong>to</strong> the EIA f<strong>or</strong>ecast, by 2030 emissions from this region are expected <strong>to</strong> be<br />
m<strong>or</strong>e than 30 percent higher than greenhouse emissions in the U.S. M<strong>or</strong>e than 40 percent of<br />
global carbon emissions expected over the next 30 years will come from China (see Figure 1-<br />
13).<br />
Energy-Related CO 2 <strong>Emissions</strong> By Region<br />
Billion Tons<br />
18.0<br />
16.0<br />
14.0<br />
12.0<br />
10.0<br />
8.0<br />
6.0<br />
4.0<br />
2.0<br />
0.0<br />
Non-OECD Asia<br />
Other OECD<br />
United States<br />
Other*<br />
Non-OECD Europe & Eurasia<br />
1990 2002 2003 2010 2015 2020 2025 2030<br />
* Middle East, Africa, Central & South America<br />
Source: Energy Inf<strong>or</strong>mation Administration, International Energy Outlook<br />
Figure 1-12: Energy-Related CO 2 <strong>Emissions</strong> by Region 1990-2030<br />
June 2007 29