DELIVERY & GROWTH FIVE-YEAR FACT BOOK - Shell
DELIVERY & GROWTH FIVE-YEAR FACT BOOK - Shell
DELIVERY & GROWTH FIVE-YEAR FACT BOOK - Shell

You also want an ePaper? Increase the reach of your titles
YUMPU automatically turns print PDFs into web optimized ePapers that Google loves.
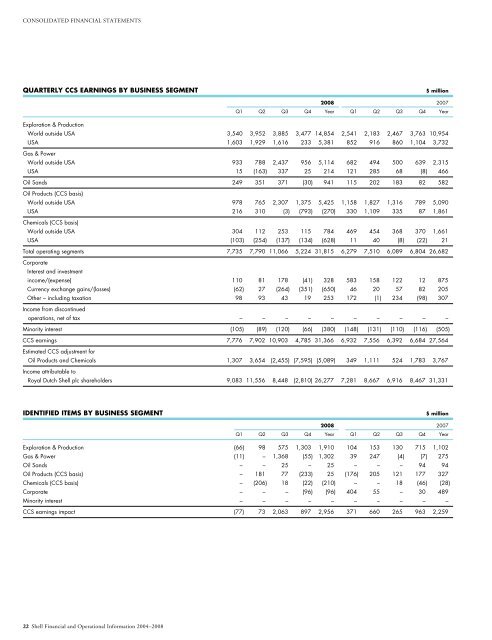
CONSOLIDATED FINANCIAL STATEMENTS<br />
QUARTERLY CCS EARNINGS BY BUSINESS SEGMENT $ million<br />
Exploration & Production<br />
22 <strong>Shell</strong> Financial and Operational Information 2004–2008<br />
2008 2007<br />
Q1 Q2 Q3 Q4 Year Q1 Q2 Q3 Q4 Year<br />
World outside USA 3,540 3,952 3,885 3,477 14,854 2,541 2,183 2,467 3,763 10,954<br />
USA 1,603 1,929 1,616 233 5,381 852 916 860 1,104 3,732<br />
Gas & Power<br />
World outside USA 933 788 2,437 956 5,114 682 494 500 639 2,315<br />
USA 15 (163) 337 25 214 121 285 68 (8) 466<br />
Oil Sands 249 351 371 (30) 941 115 202 183 82 582<br />
Oil Products (CCS basis)<br />
World outside USA 978 765 2,307 1,375 5,425 1,158 1,827 1,316 789 5,090<br />
USA 216 310 (3) (793) (270) 330 1,109 335 87 1,861<br />
Chemicals (CCS basis)<br />
World outside USA 304 112 253 115 784 469 454 368 370 1,661<br />
USA (103) (254) (137) (134) (628) 11 40 (8) (22) 21<br />
Total operating segments 7,735 7,790 11,066 5,224 31,815 6,279 7,510 6,089 6,804 26,682<br />
Corporate<br />
Interest and investment<br />
income/(expense) 110 81 178 (41) 328 583 158 122 12 875<br />
Currency exchange gains/(losses) (62) 27 (264) (351) (650) 46 20 57 82 205<br />
Other – including taxation 98 93 43 19 253 172 (1) 234 (98) 307<br />
Income from discontinued<br />
operations, net of tax – – – – – – – – – –<br />
Minority interest (105) (89) (120) (66) (380) (148) (131) (110) (116) (505)<br />
CCS earnings 7,776 7,902 10,903 4,785 31,366 6,932 7,556 6,392 6,684 27,564<br />
Estimated CCS adjustment for<br />
Oil Products and Chemicals 1,307 3,654 (2,455) (7,595) (5,089) 349 1,111 524 1,783 3,767<br />
Income attributable to<br />
Royal Dutch <strong>Shell</strong> plc shareholders 9,083 11,556 8,448 (2,810) 26,277 7,281 8,667 6,916 8,467 31,331<br />
IDENTIFIED ITEMS BY BUSINESS SEGMENT $ million<br />
2008 2007<br />
Q1 Q2 Q3 Q4 Year Q1 Q2 Q3 Q4 Year<br />
Exploration & Production (66) 98 575 1,303 1,910 104 153 130 715 1,102<br />
Gas & Power (11) – 1,368 (55) 1,302 39 247 (4) (7) 275<br />
Oil Sands – – 25 – 25 – – – 94 94<br />
Oil Products (CCS basis) – 181 77 (233) 25 (176) 205 121 177 327<br />
Chemicals (CCS basis) – (206) 18 (22) (210) – – 18 (46) (28)<br />
Corporate – – – (96) (96) 404 55 – 30 489<br />
Minority interest – – – – – – – – – –<br />
CCS earnings impact (77) 73 2,063 897 2,956 371 660 265 963 2,259