DELIVERY & GROWTH FIVE-YEAR FACT BOOK - Shell
DELIVERY & GROWTH FIVE-YEAR FACT BOOK - Shell
DELIVERY & GROWTH FIVE-YEAR FACT BOOK - Shell

Create successful ePaper yourself
Turn your PDF publications into a flip-book with our unique Google optimized e-Paper software.
REVIEW OF THE <strong>YEAR</strong><br />
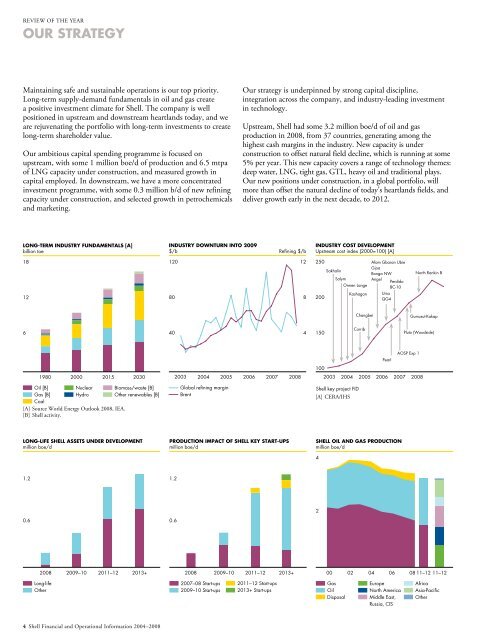
OUR STRATEGY<br />
Maintaining safe and sustainable operations is our top priority.<br />
Long-term supply-demand fundamentals in oil and gas create<br />
a positive investment climate for <strong>Shell</strong>. The company is well<br />
positioned in upstream and downstream heartlands today, and we<br />
are rejuvenating the portfolio with long-term investments to create<br />
long-term shareholder value.<br />
Our ambitious capital spending programme is focused on<br />
upstream, with some 1 million boe/d of production and 6.5 mtpa<br />
of LNG capacity under construction, and measured growth in<br />
capital employed. In downstream, we have a more concentrated<br />
investment programme, with some 0.3 million b/d of new refining<br />
capacity under construction, and selected growth in petrochemicals<br />
and marketing.<br />
LONG-TERM INDUSTRY FUNDAMENTALS [A]<br />
billion toe<br />
18<br />
12<br />
6<br />
1980 2000<br />
Oil [B]<br />
Gas [B]<br />
Coal<br />
Nuclear<br />
Hydro<br />
2015 2030<br />
[A] Source World Energy Outlook 2008, IEA.<br />
[B] <strong>Shell</strong> activity.<br />
Biomass/waste [B]<br />
Other renewables [B]<br />
LONG-LIFE SHELL ASSETS UNDER DEVELOPMENT<br />
million boe/d<br />
1.2<br />
0.6<br />
Long-life<br />
Other<br />
4 <strong>Shell</strong> Financial and Operational Information 2004–2008<br />
INDUSTRY DOWNTURN INTO 2009<br />
$/b Refining $/b<br />
120 12<br />
80 8<br />
40 4<br />
Global refining margin<br />
Brent<br />
Our strategy is underpinned by strong capital discipline,<br />
integration across the company, and industry-leading investment<br />
in technology.<br />
Upstream, <strong>Shell</strong> had some 3.2 million boe/d of oil and gas<br />
production in 2008, from 37 countries, generating among the<br />
highest cash margins in the industry. New capacity is under<br />
construction to offset natural field decline, which is running at some<br />
5% per year. This new capacity covers a range of technology themes:<br />
deep water, LNG, tight gas, GTL, heavy oil and traditional plays.<br />
Our new positions under construction, in a global portfolio, will<br />
more than offset the natural decline of today’s heartlands fields, and<br />
deliver growth early in the next decade, to 2012.<br />
INDUSTRY COST DEVELOPMENT<br />
Upstream cost index (2000=100) [A]<br />
2003 2004 2005 2006 2007 2008 2003 2004 2005 2006 2007 2008<br />
PRODUCTION IMPACT OF SHELL KEY START-UPS<br />
million boe/d<br />
2008 2009–10 2011–12 2013+ 2008 2009–10 2011–12 2013+<br />
1.2<br />
0.6<br />
2007–08 Start-ups<br />
2009–10 Start-ups<br />
2011–12 Start-ups<br />
2013+ Start-ups<br />
250<br />
200<br />
150<br />
100<br />
Sakhalin<br />
Salym<br />
Ormen Lange<br />
Kashagan<br />
Corrib<br />
<strong>Shell</strong> key project FID<br />
[A] CERA/IHS<br />
Changbei<br />
Afam Gbaran Ubie<br />
Gjoa<br />
Bonga NW<br />
Angel<br />
Perdido<br />
BC-10<br />
Ursa<br />
QG4<br />
Pearl<br />
SHELL OIL AND GAS PRODUCTION<br />
million boe/d<br />
4<br />
2<br />
00 02<br />
Gas<br />
Oil<br />
Disposal<br />
Europe<br />
North America<br />
Middle East,<br />
Russia, CIS<br />
AOSP Exp 1<br />
North Rankin B<br />
Gumusut-Kakap<br />
Pluto (Woodside)<br />
04 06 08 11–12 11–12<br />
Africa<br />
Asia-Pacific<br />
Other