

2010/2011
Estonian Human Development Report - Eesti Koostöö Kogu
Estonian Human Development Report - Eesti Koostöö Kogu
- No tags were found...

You also want an ePaper? Increase the reach of your titles
YUMPU automatically turns print PDFs into web optimized ePapers that Google loves.
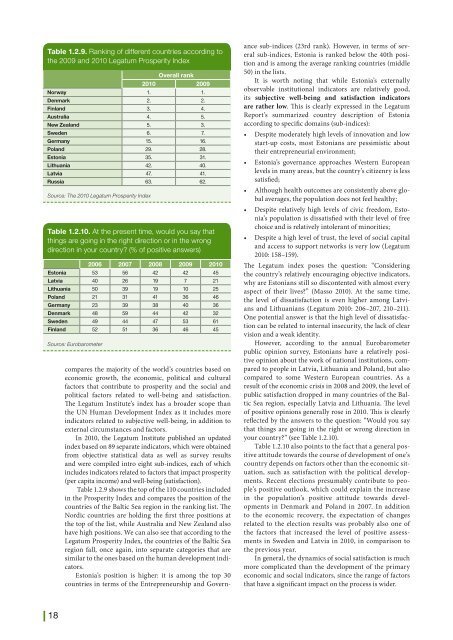
Table 1.2.9. Ranking of different countries according to<br />
the 2009 and <strong>2010</strong> Legatum Prosperity Index<br />
Source: The <strong>2010</strong> Legatum Prosperity Index<br />
Overall rank<br />
<strong>2010</strong> 2009<br />
Norway 1. 1.<br />
Denmark 2. 2.<br />
Finland 3. 4.<br />
Australia 4. 5.<br />
New Zealand 5. 3.<br />
Sweden 6. 7.<br />
Germany 15. 16.<br />
Poland 29. 28.<br />
Estonia 35. 31.<br />
Lithuania 42. 40.<br />
Latvia 47. 41.<br />
Russia 63. 62.<br />
Table 1.2.10. At the present time, would you say that<br />
things are going in the right direction or in the wrong<br />
direction in your country? (% of positive answers)<br />
Source: Eurobarometer<br />
2006 2007 2008 2009 <strong>2010</strong><br />
Estonia 53 56 42 42 45<br />
Latvia 40 26 19 7 21<br />
Lithuania 50 39 19 10 25<br />
Poland 21 31 41 36 46<br />
Germany 23 39 38 40 36<br />
Denmark 48 59 44 42 32<br />
Sweden 49 44 47 53 61<br />
Finland 52 51 36 46 45<br />
compares the majority of the world’s countries based on<br />
economic growth, the economic, political and cultural<br />
factors that contribute to prosperity and the social and<br />
political factors related to well-being and satisfaction.<br />
The Legatum Institute’s index has a broader scope than<br />
the UN Human Development Index as it includes more<br />
indicators related to subjective well-being, in addition to<br />
external circumstances and factors.<br />
In <strong>2010</strong>, the Legatum Institute published an updated<br />
index based on 89 separate indicators, which were obtained<br />
from objective statistical data as well as survey results<br />
and were compiled intro eight sub-indices, each of which<br />
includes indicators related to factors that impact prosperity<br />
(per capita income) and well-being (satisfaction).<br />
Table 1.2.9 shows the top of the 110 countries included<br />
in the Prosperity Index and compares the position of the<br />
countries of the Baltic Sea region in the ranking list. The<br />
Nordic countries are holding the first three positions at<br />
the top of the list, while Australia and New Zealand also<br />
have high positions. We can also see that according to the<br />
Legatum Prosperity Index, the countries of the Baltic Sea<br />
region fall, once again, into separate categories that are<br />
similar to the ones based on the human development indicators.<br />
Estonia’s position is higher: it is among the top 30<br />
countries in terms of the Entrepreneurship and Governance<br />
sub-indices (23rd rank). However, in terms of several<br />
sub-indices, Estonia is ranked below the 40th position<br />
and is among the average ranking countries (middle<br />
50) in the lists.<br />
It is worth noting that while Estonia’s externally<br />
observable institutional indicators are relatively good,<br />
its subjective well-being and satisfaction indicators<br />
are rather low. This is clearly expressed in the Legatum<br />
Report’s summarized country description of Estonia<br />
according to specific domains (sub-indices):<br />
• Despite moderately high levels of innovation and low<br />
start-up costs, most Estonians are pessimistic about<br />
their entrepreneurial environment;<br />
• Estonia’s governance approaches Western European<br />
levels in many areas, but the country’s citizenry is less<br />
satisfied;<br />
• Although health outcomes are consistently above global<br />
averages, the population does not feel healthy;<br />
• Despite relatively high levels of civic freedom, Estonia’s<br />
population is dissatisfied with their level of free<br />
choice and is relatively intolerant of minorities;<br />
• Despite a high level of trust, the level of social capital<br />
and access to support networks is very low (Legatum<br />
<strong>2010</strong>: 158–159).<br />
The Legatum index poses the question: “Considering<br />
the country’s relatively encouraging objective indicators,<br />
why are Estonians still so discontented with almost every<br />
aspect of their lives?” (Masso <strong>2010</strong>). At the same time,<br />
the level of dissatisfaction is even higher among Latvians<br />
and Lithuanians (Legatum <strong>2010</strong>: 206–207, 210–211).<br />
One potential answer is that the high level of dissatisfaction<br />
can be related to internal insecurity, the lack of clear<br />
vision and a weak identity.<br />
However, according to the annual Eurobarometer<br />
public opinion survey, Estonians have a relatively positive<br />
opinion about the work of national institutions, compared<br />
to people in Latvia, Lithuania and Poland, but also<br />
compared to some Western European countries. As a<br />
result of the economic crisis in 2008 and 2009, the level of<br />
public satisfaction dropped in many countries of the Baltic<br />
Sea region, especially Latvia and Lithuania. The level<br />
of positive opinions generally rose in <strong>2010</strong>. This is clearly<br />
reflected by the answers to the question: “Would you say<br />
that things are going in the right or wrong direction in<br />
your country?” (see Table 1.2.10).<br />
Table 1.2.10 also points to the fact that a general positive<br />
attitude towards the course of development of one’s<br />
country depends on factors other than the economic situation,<br />
such as satisfaction with the political developments.<br />
Recent elections presumably contribute to people’s<br />
positive outlook, which could explain the increase<br />
in the population’s positive attitude towards developments<br />
in Denmark and Poland in 2007. In addition<br />
to the economic recovery, the expectation of changes<br />
related to the election results was probably also one of<br />
the factors that increased the level of positive assessments<br />
in Sweden and Latvia in <strong>2010</strong>, in comparison to<br />
the previous year.<br />
In general, the dynamics of social satisfaction is much<br />
more complicated than the development of the primary<br />
economic and social indicators, since the range of factors<br />
that have a significant impact on the process is wider.<br />
| 18


