

2010/2011
Estonian Human Development Report - Eesti Koostöö Kogu
Estonian Human Development Report - Eesti Koostöö Kogu
- No tags were found...

Create successful ePaper yourself
Turn your PDF publications into a flip-book with our unique Google optimized e-Paper software.
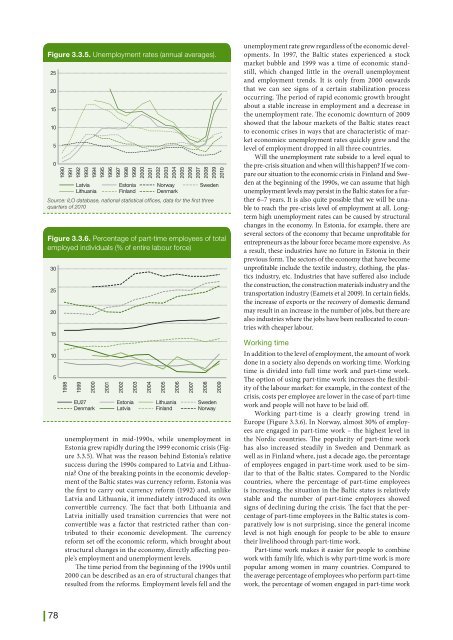
Figure 3.3.5. Unemployment rates (annual averages).<br />
25<br />
20<br />
15<br />
10<br />
5<br />
0<br />
1990<br />
1991<br />
1992<br />
1993<br />
1994<br />
Latvia<br />
Lithuania<br />
1995<br />
1996<br />
1997<br />
1998<br />
1999<br />
Estonia<br />
Finland<br />
Source: ILO database, national statistical offices, data for the first three<br />
quarters of <strong>2010</strong><br />
2000<br />
2001<br />
2002<br />
2003<br />
2004<br />
Norway<br />
Denmark<br />
2005<br />
2006<br />
2007<br />
2008<br />
2009<br />
Sweden<br />
Figure 3.3.6. Percentage of part-time employees of total<br />
employed individuals (% of entire labour force)<br />
30<br />
25<br />
20<br />
15<br />
10<br />
5<br />
1998<br />
1999<br />
2000<br />
EU27<br />
Denmark<br />
2001<br />
2002<br />
Estonia<br />
Latvia<br />
2003<br />
2004<br />
unemployment in mid-1990s, while unemployment in<br />
Estonia grew rapidly during the 1999 economic crisis (Figure<br />
3.3.5). What was the reason behind Estonia’s relative<br />
success during the 1990s compared to Latvia and Lithuania?<br />
One of the breaking points in the economic development<br />
of the Baltic states was currency reform. Estonia was<br />
the first to carry out currency reform (1992) and, unlike<br />
Latvia and Lithuania, it immediately introduced its own<br />
convertible currency. The fact that both Lithuania and<br />
Latvia initially used transition currencies that were not<br />
convertible was a factor that restricted rather than contributed<br />
to their economic development. The currency<br />
reform set off the economic reform, which brought about<br />
structural changes in the economy, directly affecting people’s<br />
employment and unemployment levels.<br />
The time period from the beginning of the 1990s until<br />
2000 can be described as an era of structural changes that<br />
resulted from the reforms. Employment levels fell and the<br />
2005<br />
2006<br />
Lithuania<br />
Finland<br />
2007<br />
2008<br />
Sweden<br />
Norway<br />
<strong>2010</strong><br />
2009<br />
unemployment rate grew regardless of the economic developments.<br />
In 1997, the Baltic states experienced a stock<br />
market bubble and 1999 was a time of economic standstill,<br />
which changed little in the overall unemployment<br />
and employment trends. It is only from 2000 onwards<br />
that we can see signs of a certain stabilization process<br />
occurring. The period of rapid economic growth brought<br />
about a stable increase in employment and a decrease in<br />
the unemployment rate. The economic downturn of 2009<br />
showed that the labour markets of the Baltic states react<br />
to economic crises in ways that are characteristic of market<br />
economies: unemployment rates quickly grew and the<br />
level of employment dropped in all three countries.<br />
Will the unemployment rate subside to a level equal to<br />
the pre-crisis situation and when will this happen? If we compare<br />
our situation to the economic crisis in Finland and Sweden<br />
at the beginning of the 1990s, we can assume that high<br />
unemployment levels may persist in the Baltic states for a further<br />
6–7 years. It is also quite possible that we will be unable<br />
to reach the pre-crisis level of employment at all. Longterm<br />
high unemployment rates can be caused by structural<br />
changes in the economy. In Estonia, for example, there are<br />
several sectors of the economy that became unprofitable for<br />
entrepreneurs as the labour force became more expensive. As<br />
a result, these industries have no future in Estonia in their<br />
previous form. The sectors of the economy that have become<br />
unprofitable include the textile industry, clothing, the plastics<br />
industry, etc. Industries that have suffered also include<br />
the construction, the construction materials industry and the<br />
transportation industry (Eamets et al 2009). In certain fields,<br />
the increase of exports or the recovery of domestic demand<br />
may result in an increase in the number of jobs, but there are<br />
also industries where the jobs have been reallocated to countries<br />
with cheaper labour.<br />
Working time<br />
In addition to the level of employment, the amount of work<br />
done in a society also depends on working time. Working<br />
time is divided into full time work and part-time work.<br />
The option of using part-time work increases the flexibility<br />
of the labour market: for example, in the context of the<br />
crisis, costs per employee are lower in the case of part-time<br />
work and people will not have to be laid off.<br />
Working part-time is a clearly growing trend in<br />
Europe (Figure 3.3.6). In Norway, almost 30% of employees<br />
are engaged in part-time work – the highest level in<br />
the Nordic countries. The popularity of part-time work<br />
has also increased steadily in Sweden and Denmark as<br />
well as in Finland where, just a decade ago, the percentage<br />
of employees engaged in part-time work used to be similar<br />
to that of the Baltic states. Compared to the Nordic<br />
countries, where the percentage of part-time employees<br />
is increasing, the situation in the Baltic states is relatively<br />
stable and the number of part-time employees showed<br />
signs of declining during the crisis. The fact that the percentage<br />
of part-time employees in the Baltic states is comparatively<br />
low is not surprising, since the general income<br />
level is not high enough for people to be able to ensure<br />
their livelihood through part-time work.<br />
Part-time work makes it easier for people to combine<br />
work with family life, which is why part-time work is more<br />
popular among women in many countries. Compared to<br />
the average percentage of employees who perform part-time<br />
work, the percentage of women engaged in part-time work<br />
| 78


