ISRA VISION AG HIGH(-) EUR 24.00(-) 04 AUGUST 2011
ISRA VISION AG HIGH(-) EUR 24.00(-) 04 AUGUST 2011
ISRA VISION AG HIGH(-) EUR 24.00(-) 04 AUGUST 2011

You also want an ePaper? Increase the reach of your titles
YUMPU automatically turns print PDFs into web optimized ePapers that Google loves.
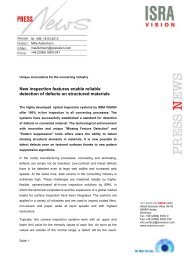
<strong>ISRA</strong> <strong>VISION</strong> <strong>AG</strong><br />
Recommendation:<br />
BUY(Initial Coverage)<br />
Key data<br />
Risk:<br />
<strong>HIGH</strong> (-)<br />
Price Target:<br />
<strong>EUR</strong> <strong>24.00</strong>(-)<br />
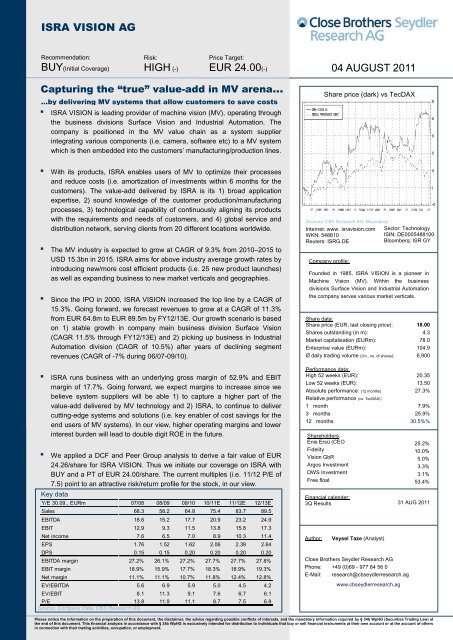
Capturing the “true” value-add in MV arena…<br />
…by delivering MV systems that allow customers to save costs<br />
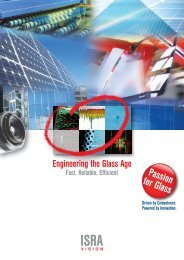
▪ <strong>ISRA</strong> <strong>VISION</strong> is leading provider of machine vision (MV), operating through<br />
the business divisions Surface Vision and Industrial Automation. The<br />
company is positioned in the MV value chain as a system supplier<br />
integrating various components (i.e. camera, software etc) to a MV system<br />
which is then embedded into the customers‟ manufacturing/production lines.<br />
▪ With its products, <strong>ISRA</strong> enables users of MV to optimize their processes<br />
and reduce costs (i.e. amortization of investments within 6 months for the<br />
customers). The value-add delivered by <strong>ISRA</strong> is its 1) broad application<br />
expertise, 2) sound knowledge of the customer production/manufacturing<br />
processes, 3) technological capability of continuously aligning its products<br />
with the requirements and needs of customers, and 4) global service and<br />
distribution network, serving clients from 20 different locations worldwide.<br />
▪ The MV industry is expected to grow at C<strong>AG</strong>R of 9.3% from 2010–2015 to<br />
USD 15.3bn in 2015. <strong>ISRA</strong> aims for above industry average growth rates by<br />
introducing new/more cost efficient products (i.e. 25 new product launches)<br />
as well as expanding business to new market verticals and geographies.<br />
▪ Since the IPO in 2000, <strong>ISRA</strong> <strong>VISION</strong> increased the top line by a C<strong>AG</strong>R of<br />
15.3%. Going forward, we forecast revenues to grow at a C<strong>AG</strong>R of 11.3%<br />
from <strong>EUR</strong> 64.8m to <strong>EUR</strong> 89.5m by FY12/13E. Our growth scenario is based<br />
on 1) stable growth in company main business division Surface Vision<br />
(C<strong>AG</strong>R 11.5% through FY12/13E) and 2) picking up business in Industrial<br />
Automation division (C<strong>AG</strong>R of 10.5%) after years of declining segment<br />
revenues (C<strong>AG</strong>R of -7% during 06/07-09/10).<br />
▪ <strong>ISRA</strong> runs business with an underlying gross margin of 52.9% and EBIT<br />
margin of 17.7%. Going forward, we expect margins to increase since we<br />
believe system suppliers will be able 1) to capture a higher part of the<br />
value-add delivered by MV technology and 2) <strong>ISRA</strong>, to continue to deliver<br />
cutting-edge systems and solutions (i.e. key enabler of cost savings for the<br />
end users of MV systems). In our view, higher operating margins and lower<br />
interest burden will lead to double digit ROE in the future.<br />
▪ We applied a DCF and Peer Group analysis to derive a fair value of <strong>EUR</strong><br />
24.26/share for <strong>ISRA</strong> <strong>VISION</strong>. Thus we initiate our coverage on <strong>ISRA</strong> with<br />
BUY and a PT of <strong>EUR</strong> <strong>24.00</strong>/share. The current multiples (i.e. 11/12 P/E of<br />
7.5) point to an attractive risk/return profile for the stock, in our view.<br />
Y/E 30.09., <strong>EUR</strong>m 07/08 08/09 09/10 10/11E 11/12E 12/13E<br />
Sales 68.3 58.2 64.8 75.4 83.7 89.5<br />
EBITDA 18.6 15.2 17.7 20.9 23.2 24.9<br />
EBIT 12.9 9.3 11.5 13.8 15.8 17.3<br />
Net income 7.6 6.5 7.0 8.9 10.3 11.4<br />
EPS 1.76 1.52 1.62 2.06 2.39 2.64<br />
DPS 0.15 0.15 0.20 0.20 0.20 0.20<br />
EBITDA margin 27.2% 26.1% 27.2% 27.7% 27.7% 27.8%<br />
EBIT margin 18.9% 15.9% 17.7% 18.3% 18.9% 19.3%<br />
Net margin 11.1% 11.1% 10.7% 11.8% 12.4% 12.8%<br />
EV/EBITDA 5.6 6.9 5.9 5.0 4.5 4.2<br />
EV/EBIT 8.1 11.3 9.1 7.6 6.7 6.1<br />
P/E 13.8 11.9 11.1 8.7 7.5 6.8<br />
Source: Company Data, CBS Research <strong>AG</strong><br />
<strong>04</strong> <strong>AUGUST</strong> <strong>2011</strong><br />
Share price (dark) vs TecDAX<br />
Sources: CBS Research <strong>AG</strong>, Bloomberg<br />
Internet: www. isravision.com<br />
WKN: 548810<br />
Reuters: ISRG.DE<br />
Company profile:<br />
Share data:<br />
Share price (<strong>EUR</strong>, last closing price):<br />
Shares outstanding (in m):<br />
Market capitalisation (<strong>EUR</strong>m):<br />
Enterprise value (<strong>EUR</strong>m):<br />
Ø daily trading volume (3m., no. of shares):<br />
Performance data:<br />
High 52 weeks (<strong>EUR</strong>):<br />
Low 52 weeks (<strong>EUR</strong>):<br />
Absolute performance: (12 months)<br />
Relative performance (vs. TecDAX):<br />
1 month<br />
3 months<br />
12 months<br />
Shareholders:<br />
Enis Ersü (CEO<br />
Fidelity<br />
Vision GbR<br />
Argos Investment<br />
DWS Investment<br />
Free float<br />
Financial calender:<br />
3Q Results<br />
Author: Veysel Taze (Analyst)<br />
Sector: Technology<br />
ISIN: DE0005488100<br />
Bloomberg: ISR GY<br />
Founded in 1985, <strong>ISRA</strong> <strong>VISION</strong> is a pioneer in<br />
Machine Vision (MV). Within the business<br />
divisions Surface Vision and Industrial Automation<br />
the company serves various market verticals.<br />
Close Brothers Seydler Research <strong>AG</strong><br />
Phone: +49 (0)69 - 977 84 56 0<br />
E-Mail: research@cbseydlerresearch.ag<br />
www.cbseydlerresearch.ag<br />
Please notice the information on the preparation of this document, the disclaimer, the advice regarding possible conflicts of interests, and the mandatory information required by § 34b WpHG (Securities Trading Law) at<br />
the end of this document. This financial analysis in accordance with § 34b WpHG is exclusively intended for distribution to individuals that buy or sell financial instruments at their own account or at the account of others<br />
in connection with their trading activities, occupation, or employment.<br />
18.00<br />
4.3<br />
78.0<br />
1<strong>04</strong>.9<br />
6,900<br />
20.35<br />
13.50<br />
27.3%<br />
7.9%<br />
25.9%<br />
30.5%%<br />
25.2%<br />
10.0%<br />
5.0%<br />
3.3%<br />
3.1%<br />
53.4%<br />
31 AUG <strong>2011</strong>
<strong>ISRA</strong> <strong>VISION</strong> <strong>AG</strong><br />
Table of content<br />
Investment thesis ............................................................... 3<br />
SWOT Analysis ................................................................... 5<br />
www.cbseydlerresearch.ag<br />
Strengths ...................................................................................................... 5<br />
Weaknesses ................................................................................................. 5<br />
Opportunities ................................................................................................ 5<br />
Threats .......................................................................................................... 5<br />
Valuation ............................................................................ 6<br />
DCF Valuation .............................................................................................. 6<br />
Peer Group Valuation ................................................................................... 7<br />
Peer group valuation .................................................................................. 9<br />
MV Technology and Industry ............................................ 11<br />
<strong>ISRA</strong>´s market position in the value chain ................................................ 12<br />
The Company: Pioneer in MV ........................................... 13<br />
History ...................................................................................................... 13<br />
Company Structure .................................................................................. 14<br />
Shareholder Structure .............................................................................. 14<br />
Management ............................................................................................ 14<br />
Business Model........................................................................................... 15<br />
Surface Vision .......................................................................................... 16<br />
Industrial Automation ............................................................................... 17<br />
Growth strategy........................................................................................... 18<br />
MV Market ........................................................................ 19<br />
European machine vision market ............................................................. 19<br />
Financial review ............................................................... 22<br />
1H FY10/11 results .................................................................................. 23<br />
Forecasts .................................................................................................... 23<br />
Balance sheet and cash ........................................................................... 24<br />
Profit and loss account ................................................................................ 26<br />
Balance Sheet .......................................................................................... 27<br />
Cash Flow statement ............................................................................... 28<br />
Close Brothers Seydler Research <strong>AG</strong> | 2
<strong>ISRA</strong> <strong>VISION</strong> <strong>AG</strong><br />
Investment thesis<br />
Founded in 1985, <strong>ISRA</strong> <strong>VISION</strong> is one of the world´s leading companies of industrial<br />
image processing (machine vision). The <strong>ISRA</strong> Group offers a broad range of machine<br />
vision systems for surface inspection, robot guidance and quality control. The core<br />
competence of the company is <strong>ISRA</strong>-BrainWARE®, an innovative software for<br />
intelligent machine vision system. BrainWARE® integrates different technologies in<br />
an advanced software system for standard application in the industry. It combines the<br />
company´s broad application expertise with scientific know-how from optics, image<br />
processing, advanced illumination, intelligent classification, real time software,<br />
cognitive image analysis, 3D measurement, pattern recognition, multi-view and multimode<br />
image capturing. Within the business divisions Surface Vision and Industrial<br />
Automation the company serves various industries holding leading market position in<br />
the market verticals Glass (market share ~80%), Metal (~60%), Automotive (~30%)<br />
and Plastic (~30%).<br />
Technology and positioning: Machine Vision (industrial image processing) is a<br />
key technology in the area of automation, production control and fully automated<br />
quality assurance. <strong>ISRA</strong> <strong>VISION</strong> is positioned in the MV value chain as a system<br />
supplier, integrating various components (i.e. camera, software etc) into a MV system<br />
which is then embedded into the customers‟ manufacturing/production line. In our<br />
view <strong>ISRA</strong> delivers following key competitive advantages 1) broad application<br />
expertise, 2) sound knowledge of the customer production/manufacturing processes,<br />
3) technological capability of continuously aligning its products with the requirements<br />
and needs of customers and 4) global service and distribution network.<br />
Key enabler of cost benefits: In our view, the current technological<br />
requirements (i.e. higher data rates, greater real time image processing etc) allow<br />
components suppliers such as camera and sensor providers to capture a significant<br />
part of the value-add delivered by MV technology. However, going forward, we think<br />
that the application expertise, the knowledge of the customers´ production processes,<br />
the flexibility of the MV system and greater/autonomous robotic capabilities will be<br />
the main factors favoring the business models of system suppliers such as <strong>ISRA</strong><br />
<strong>VISION</strong>. Thus we believe that system suppliers are better positioned to capture a<br />
greater part of the value-add in the future by monetizing on their broad application<br />
expertise and direct access to customers.<br />
Business model: The Company operates through the business segments Surface<br />
Vision and Industrial Automation, serving various end markets on a global scale. The<br />
company offers a broad product range of standardized and customized solutions for<br />
automating both quality inspection and production. With a revenue contribution of<br />
~80% and an underlying EBIT margin of 18%, Surface Vision is by far <strong>ISRA</strong>´s largest<br />
business segment. In Industrial Automation (EBIT margin >16%) the company<br />
focuses on technology of robot guidance, delivering all core components of the<br />
system from one source. The company supplies its systems and solutions either<br />
directly to end users of their systems or to original equipment manufacturers (OEMs)<br />
who integrate MV systems into their equipment.<br />
Market verticals and benefits: <strong>ISRA</strong> <strong>VISION</strong> currently serves eight different<br />
market verticals, ranking among the top three system suppliers in most of its end<br />
markets. The company is particularly strong in industries with a high degree of<br />
automated production and quality inspection such as automotive, metals, glass,<br />
plastics and paper. The company considers Energy, Healthcare, Food,<br />
Transportation and Information as potential growth markets (“mega-markets”)<br />
www.cbseydlerresearch.ag<br />
Pioneer in MV with<br />
strong market position<br />
in some industries<br />
Positioned as system<br />
supplier within the MV<br />
value chain<br />
From mid-term<br />
perspective we prefer<br />
MV system supplier<br />
over component<br />
providers<br />
Two business segment<br />
with attractive<br />
margins<br />
Serving eight different<br />
market verticals by<br />
providing high return<br />
on investment for its<br />
customers<br />
Close Brothers Seydler Research <strong>AG</strong> | 3
<strong>ISRA</strong> <strong>VISION</strong> <strong>AG</strong><br />
pursuing an opportunistic business approach in serving the sub-segments of these<br />
mega markets either directly or indirectly. With its systems and solutions, <strong>ISRA</strong><br />
enables end users of MV to optimize their processes and reduce costs. Thus the<br />
company´s systems offer an attractive return on investments for its customers<br />
allowing a swift amortization of the investments within the first six months.<br />
Strategy: <strong>ISRA</strong> pursues a Multi-Branch strategy based on three core strategic<br />
pillars 1) Technologies, 2) Industries and 3) Regions. By implementing the Multi-<br />
Branch strategy <strong>ISRA</strong> aims to achieve a higher diversification in terms of<br />
applications, customers, verticals and geographies, while focusing at the same time<br />
on long-term profitable growth. This allows the company to become more<br />
independent from industry-specific and regional business cycles as well as<br />
customers. For the upcoming years the management targets organic revenue growth<br />
that exceed the <strong>EUR</strong> 100m mark.<br />
Financials: Over the period FY06/07-09/10 (i.e. financial year from 1 October to 30<br />
September) <strong>ISRA</strong> <strong>VISION</strong> increased sales by a C<strong>AG</strong>R of 8.2% from <strong>EUR</strong> 51.3m to<br />
<strong>EUR</strong> 64.8m in FY 09/10. Going forward we expect growth to accelerate to C<strong>AG</strong>R of<br />
11.3% from <strong>EUR</strong> 64.8m to <strong>EUR</strong> 89.5m over the period FY09/10 to FY12/13E. Our<br />
growth scenario is based on 1) stable double digit growth in company´s core<br />
business division Surface Vision (C<strong>AG</strong>R of 11.5% to <strong>EUR</strong> 73.9m by FY12/13E) and<br />
2) recovery in Industrial Automation business (C<strong>AG</strong>R of 10.5%) after years of<br />
declining segment revenues (C<strong>AG</strong>R of -7% during 06/07-09/10).<br />
Margin development: <strong>ISRA</strong> runs business with an underlying gross margin of<br />
52.9% and EBIT margin 17.7% (based on reported IFRS numbers as of FY09/10)<br />
which should continue to increase since we believe system suppliers will be able to<br />
capture a higher part of the value-add delivered by MV technology. Thus we think<br />
<strong>ISRA</strong> will still have pricing power in the future and continue to deliver cutting-edge<br />
systems (i.e. key enabler of cost savings for the end users of MV systems). This<br />
combined with lean cost platform should allow the company to expand gross margin<br />
to 55.1% and EBIT to 19.3% by FY12/13E. Higher operating margins and lower<br />
interest burden will in our view result on double digit ROE of 10.3% by FY12/13E.<br />
Valuation: We applied a multiple valuation based on a peer group analysis and a<br />
Discounted Cash Flow (DCF) model to determine the fair value of <strong>ISRA</strong> <strong>VISION</strong>. By<br />
combining both valuation methods, we arrived at fair value of <strong>EUR</strong> 24.26 per share.<br />
Thus we initiate our coverage on <strong>ISRA</strong> with a BUY recommendation and a price<br />
target (PT) of <strong>EUR</strong> <strong>24.00</strong>/share. This indicates an upside potential of more than 33%<br />
to company´s last closing price of <strong>EUR</strong> 18.00.<br />
www.cbseydlerresearch.ag<br />
Reducing dependency<br />
on technology,<br />
customers and<br />
verticals through<br />
diversification<br />
Top line C<strong>AG</strong>R of<br />
11.3% over the period<br />
through FY12/13E....<br />
.... and “room” for<br />
margin expansion in<br />
the future<br />
PT of <strong>EUR</strong> <strong>24.00</strong>/share<br />
Close Brothers Seydler Research <strong>AG</strong> | 4
<strong>ISRA</strong> <strong>VISION</strong> <strong>AG</strong><br />
SWOT Analysis<br />
Strengths<br />
� Leading market position in some niches: Global market leader for Surface<br />
Vision with dominant market position in glass, metals, automotive and plastic.<br />
� Diversification benefits: <strong>ISRA</strong> runs a well diversified business in terms of<br />
technology, market verticals and geographic markets.<br />
� Pioneer in MV systems: <strong>ISRA</strong> has more than 25 years of expertise in providing<br />
MV systems. Thus the company has allocated broad application and industry<br />
specific engineering know-how over the years.<br />
� Broad customer base: With its key account management, global sales and<br />
service network, the company has excellent access to end users of MV systems.<br />
� Sound margins: Based on reported numbers the company runs business on<br />
gross margin >54% and EBIT margin >18% (as of 1H of FY10/11) which are<br />
among the highest within the MV industry.<br />
Weaknesses<br />
� Inefficient working capital management: The company has a high need of<br />
working capital which leaves room for optimization going forward.<br />
� Industrial Automation: Sales in Industrial Automation division has been<br />
declining over the last years which we think can be turned around considering the<br />
company´s investment in the area of 3D machine vision.<br />
� Some of company´s end markets are highly cyclical.<br />
Opportunities<br />
� Promising market: MV technology is still in early adoption phase in various end<br />
markets. Going forward, we think new application areas and market verticals will<br />
open-up providing promising growth prospects. According to the company, only<br />
~20% of the potential MV applications have been addressed up to now.<br />
� New market verticals: The company considers Energy, Healthcare, Food,<br />
Transportation and Information as potential growth markets (“mega-markets”)<br />
pursuing an opportunistic business approach in serving the sub-segments of<br />
these mega markets either directly or indirectly.<br />
� New geographies: In the past, <strong>ISRA</strong> generated the core of its revenues in<br />
Europe. However, the company is expanding business activities into fast growing<br />
markets such as Asia, Americas, Middle East and Eastern Europe.<br />
� Acquisitive growth: The MV industry is still highly fragmented, consisting of a<br />
large number of privately held companies that focus on certain niches and<br />
regions. Thus the industry still offers attractive take-over targets.<br />
� Evolving growth prospects from the 3D machine vision technology<br />
Threats<br />
� Growing competition: Given the attractive margins in the MV system business<br />
we think competitive pressure will grow in the future.<br />
� Impairment risk: Considering the high amount of goodwill of <strong>EUR</strong> 37.3m and<br />
capitalized development costs of <strong>EUR</strong> 28.1m of (FY09/10) <strong>ISRA</strong>´s balance sheet<br />
bears risk of potential impairments in case of non-profitability.<br />
� Technological risks: MV industry is driven by short technology cycles and<br />
changing customer requirements. A failure to adopt new technological trends and<br />
customer requirements would harm the company´s profitability.<br />
www.cbseydlerresearch.ag<br />
Close Brothers Seydler Research <strong>AG</strong> | 5
<strong>ISRA</strong> <strong>VISION</strong> <strong>AG</strong><br />
Valuation<br />
We applied a multiple valuation based on a peer group analysis and a Discounted<br />
Cash Flow (DCF) model to determine the fair value of <strong>ISRA</strong> <strong>VISION</strong> <strong>AG</strong>. Our peer<br />
group analysis based on P/E and Enterprise value (EV) multiples resulted in a fair<br />
value of <strong>EUR</strong> 22.52 per share. Our DCF model yields fair value of <strong>EUR</strong> 25.01 per<br />
share. By combining both valuation methods, we arrived at fair value of <strong>EUR</strong> 24.26<br />
per share. Thus we initiate our coverage on <strong>ISRA</strong> with a BUY recommendation and a<br />
price target (PT) of <strong>EUR</strong> <strong>24.00</strong> per share. This indicates an upside potential of more<br />
than 33% to company´s last closing price of <strong>EUR</strong> 18.00.<br />
Valuation methods<br />
Source: CBS Research <strong>AG</strong><br />
Although acquisitions are part of <strong>ISRA</strong> growth strategy, we excluded any possible<br />
future takeovers from our model. Thus we stick to a conservative valuation approach<br />
in deriving the company´s fair value on the basis of organic growth. In order to<br />
incorporate acquisitions into estimates and modelling, we would need to estimate<br />
potential sales and earnings, arisen from new acquisitions as well as corresponding<br />
acquisition costs. Furthermore, the consideration of potential acquisition would also<br />
require further assumptions regarding financing aspects. Thus such assumptions<br />
might distort the model and result in a highly misleading fair value. However, we<br />
would like to highlight the upside potential to our estimates arising from potential<br />
future acquisitions.<br />
DCF Valuation<br />
www.cbseydlerresearch.ag<br />
Weighting Fair value<br />
factor per share<br />
Peer group valuation 30.0% 22.52<br />
DCF valuation 70.0% 25.01<br />
Fair value per share 24.26<br />
Price Target <strong>24.00</strong><br />
We applied a three stage Discounted Cash Flow (DCF) model to calculate the fair<br />
value of <strong>ISRA</strong> <strong>VISION</strong> by discounting the company´s future cash flows. Our DCF<br />
Model is based on the following assumptions:<br />
Weighted average cost of capital (WACC): On the basis of current long-term yields<br />
of German federal bonds, we set the risk-free rate at 3.5%. We assumed an equity<br />
risk premium of 6.0%, and a debt risk premium of 3.0%. We decided to apply a beta<br />
of 1.40 to our DCF valuation which is significantly above its historical value. The<br />
reason for this adjustment was mainly due to cyclical characteristics of its underlying<br />
business as well as potential risks arising from company´s buy and build strategy.<br />
We, furthermore, assumed a long-term target equity ratio of 70%. These premises<br />
led to a WACC of 9.70%.<br />
Phase 1 (10/11E-12/13E): We estimated the free cash flows (FCF) of phase 1<br />
according to our detailed financial forecasts for this period described in the financials<br />
section of this document.<br />
Our price target: <strong>EUR</strong><br />
<strong>24.00</strong> per share<br />
Our estimates based<br />
on organic growth<br />
WACC of 9.70%<br />
Phase 1: Detailed<br />
forecasts<br />
Close Brothers Seydler Research <strong>AG</strong> | 6
<strong>ISRA</strong> <strong>VISION</strong> <strong>AG</strong><br />
Phase 2 (13/14E-19/20E): For Phase 2, we made more general assumptions,<br />
considering the expected industry growth and <strong>ISRA</strong>´s market position. We believe<br />
that company will yield the fruits of its business expansion. Overall, we allowed<br />
annual revenue growth to decrease successively to 2.0%, resulting in a C<strong>AG</strong>R<br />
13/14E-19/20E of 3.6%. We assumed that the company can achieve in the long run<br />
an EBIT margin of 16.0%.<br />
Phase 3: We applied a long-term FCF growth rate of 2.0% for the calculation of the<br />
terminal value which we believe is reasonable considering the growth prospects in<br />
company´s underlying business.<br />
Based on these assumptions, we derived a fair value of equity <strong>EUR</strong> 108.4m,<br />
translating into a fair value of <strong>EUR</strong> 25.01 per share. We calculated a fair value of the<br />
operating business of <strong>EUR</strong> 135.3m and added back the company´s cash position of<br />
<strong>EUR</strong> 6.0m. We furthermore deducted company´s debt of <strong>EUR</strong> 32.9m to derive the<br />
company´s fair value. Our fair value per share estimates are based on 4.3m shares<br />
outstanding.<br />
DCF Valuation<br />
Source: CBS Research <strong>AG</strong><br />
Peer Group Valuation<br />
Along with a DCF Model, we applied a peer group analysis based on common EV<br />
and P/E multiples for the FY10/11E and FY11/12E, respectively. Our peer group<br />
consists of close peers such as Cognex, AVT, Orbotech or Perceptron with main<br />
business emphasis of MV systems as well as the German MV camera suppliers<br />
<strong>AUGUST</strong>A Technologies <strong>AG</strong> and BASLER <strong>AG</strong>. Despite the differences in the<br />
business model between the German camera suppliers and <strong>ISRA</strong> <strong>VISION</strong> we<br />
www.cbseydlerresearch.ag<br />
PHASE 1 PHASE 2 PHASE 3<br />
<strong>EUR</strong>m 10/11E 11/12E 12/13E 13/14E 14/15E 15/16E 16/17E 17/18E 18/19E 19/20E<br />
Sales 75.4 83.7 89.5 95.3 100.6 105.6 109.8 113.1 115.4 117.7<br />
Y-o-Y grow th 16.3% 10.9% 7.0% 6.5% 5.5% 5.0% 4.0% 3.0% 2.0% 2.0%<br />
EBIT 13.8 15.8 17.3 18.6 19.1 19.0 19.8 19.8 19.6 18.8<br />
EBIT margin 18.3% 18.9% 19.3% 19.5% 19.0% 18.0% 18.0% 17.5% 17.0% 16.0%<br />
Income tax on EBIT -4.1 -4.7 -5.2 -5.6 -5.7 -5.7 -5.9 -5.9 -5.9 -5.6<br />
Depreciation and amortisation 7.1 7.4 7.6 7.7 7.8 7.9 8.0 8.0 8.0 8.0<br />
Change in net working capital 2.1 -1.6 -2.1 -1.7 -1.6 -1.5 -1.3 -1.0 -0.7 -0.7<br />
Net capital expenditure -8.5 -8.4 -8.4 -8.5 -8.4 -8.3 -8.3 -8.2 -8.0 -8.0<br />
Free cash flow 10.3 8.46 9.2 10.5 11.2 11.4 12.3 12.7 13.1 12.6<br />
Present values 9.8 7.3 7.2 7.5 7.2 6.7 6.5 6.1 5.7 5.0 66.2<br />
Present value Phase 1 24.3 Risk free rate 3.50% Target equity ratio 70.0%<br />
Present value Phase 2 44.7 Equity risk premium 6.00% Beta 1.40<br />
Present value Phase 3 66.2 Debt risk premium 3.00% WACC 9.70%<br />
Total present value 135.3 Tax shield (Phase 3) 29.5% Terminal growth 2.00%<br />
+ Excess cash/Non-operating assets 6.0<br />
- Financial debt -32.9<br />
Phase 2: C<strong>AG</strong>R of 3.6%<br />
Phase 3: 2.0% growth<br />
for terminal value<br />
Fair Value of <strong>EUR</strong><br />
25.01 per share<br />
Sensitivity analysis<br />
Terminal growth (Phase 3)<br />
1.0% 1.5% 2.0% 2.5% 3.0%<br />
Fair value of equity 108.4 8.70% 27.11 28.36 29.78 31.44 33.39<br />
9.20% 24.99 26.<strong>04</strong> 27.23 28.60 30.19<br />
Number of shares outstanding (m) 4.3 WACC 9.70% 23.12 <strong>24.00</strong> 25.01 26.15 27.46<br />
10.20% 21.44 22.20 23.05 24.01 25.10<br />
Fair value per share 25.01 10.70% 19.95 20.60 21.32 22.13 23.05<br />
Peer group consists of<br />
MV system suppliers<br />
and MV component<br />
providers<br />
Close Brothers Seydler Research <strong>AG</strong> | 7<br />
8
<strong>ISRA</strong> <strong>VISION</strong> <strong>AG</strong><br />
nevertheless believe that current market multiples for BASLER and <strong>AUGUST</strong>A<br />
Technologies provide a reliable indication for a market based valuation approach.<br />
However, it is worth to note that the companies in our peer group considerably vary in<br />
terms of business activities ranging from highly focused small caps such as AVT and<br />
Perceptron to the more diversified large caps such as Cognex or Orbotech. In our<br />
peer group we think the closest peer is Cognex as it targets similar end markets like<br />
<strong>ISRA</strong>. Below we provide a more detailed overview of the peer companies.<br />
Overview of relevant peers<br />
Company name<br />
Source: Bloomberg, CBS Research <strong>AG</strong><br />
Our peer group consists of the following companies:<br />
Cognex Corporation is the world‟s leading provider of MV systems and sensor<br />
supplier. In MV systems the company provides broad range of products targeting<br />
similar markets like <strong>ISRA</strong>. The company is also a leader in industrial ID readers.<br />
Given the company broad business approach Cognex generates currently the<br />
highest margins within the industry. Revenues for the 1Q<strong>2011</strong> (ending 02 April)<br />
increased 26% from the first quarter of 2010 and decreased 12% from the prior<br />
quarter. The underlying operating income amounted to USD 17.4m corresponding to<br />
an EBIT margin of 23% compared to 19% in 1Q2010.<br />
Orbotech Ltd. is a leading supplier of high-speed automated optical inspection (AOI)<br />
systems used to identify defects in the printed circuit boards (PCBs), integrated<br />
circuit packaging, flat-panel displays, and electronic assemblies found in computers,<br />
cell phones, and other communications systems. Through subsidiary Orbograph, it<br />
makes character recognition software used by banks to process checks and detect<br />
fraud. Revenues for 1Q<strong>2011</strong> totaled USD 134.2m, compared to USD 128.4m in the<br />
fourth quarter, and USD 100.0m in the first quarter, of 2010. In 1Q<strong>2011</strong> operating<br />
www.cbseydlerresearch.ag<br />
Cognex is closest peer<br />
Market EV EPS EBIT<br />
Sales<br />
cap. 10/11E 11/12E 12/13E 10/11E 11/12E 12/13E 10/11E 11/12E 12/13E<br />
<strong>ISRA</strong> Vision <strong>AG</strong> 81.7 108.6 2.06 2.39 2.64 13.8 15.8 17.3 75.4 83.7 89.5<br />
COGNEX CORP 1,499.6 1,254.9 1.58 1.81 - 84.2 101.7 - 322.0 361.2 -<br />
ADVANCED <strong>VISION</strong> TECHNOLOGY 18.5 14.0 0.28 0.38 0.45 1.9 2.7 3.9 30.6 33.7 37.7<br />
ORBOTECH LTD 420.7 238.1 1.64 1.71 - 81.9 93.9 - 574.0 622.0 -<br />
PERCEPTRON INC 57.9 33.9 0.15 0.26 - 1.6 3.4 - 56.5 62.0 -<br />
BASLER <strong>AG</strong> 45.7 43.3 1.19 1.32 1.56 7.4 7.9 9.1 55.3 59.5 65.2<br />
<strong>AUGUST</strong>A TECHNOLOGIE <strong>AG</strong> 131.7 132.0 1.90 2.42 2.71 22.5 28.0 31.3 158.5 180.5 195.0<br />
Company name Net margin EBIT-margin<br />
Sales growth<br />
10/11E 11/12E 12/13E 10/11E 11/12E 12/13E 10/11E 11/12E 12/13E<br />
<strong>ISRA</strong> Vision <strong>AG</strong> 11.8% 12.4% 12.8% 18.3% 18.9% 19.3% 16.3% 10.9% 7.0%<br />
COGNEX CORP 20.4% 21.7% - 26.2% 28.2% - 8.4% 12.2% -<br />
ADVANCED <strong>VISION</strong> TECHNOLOGY 5.7% 7.0% 7.5% 6.2% 8.2% 10.2% 4.6% 10.2% 12.0%<br />
ORBOTECH LTD 11.8% 12.6% - 14.3% 15.1% - 8.8% 8.4% -<br />
PERCEPTRON INC 2.5% 3.9% - 2.9% 5.4% - 7.8% 9.7% -<br />
BASLER <strong>AG</strong> 7.5% 7.8% 8.4% 13.4% 13.3% 13.9% 8.4% 7.6% 9.6%<br />
<strong>AUGUST</strong>A TECHNOLOGIE <strong>AG</strong> 9.1% 10.2% 10.5% 14.2% 15.5% 16.1% 25.1% 13.9% 8.0%<br />
Average 9.5% 10.5% 8.8% 12.9% 14.3% 13.4% 10.5% 10.3% 9.9%<br />
Median 8.3% 9.0% 8.4% 13.8% 14.2% 13.9% 8.4% 10.0% 9.6%<br />
Our peer group<br />
consists of: Cognex...<br />
...Orbotech...<br />
Close Brothers Seydler Research <strong>AG</strong> | 8
<strong>ISRA</strong> <strong>VISION</strong> <strong>AG</strong><br />
income more than doubled compared to the same quarter of previous year achieving<br />
USD 15.1m.<br />
Advanced Vision Technology, Ltd (AVT) is the world leader in print process control,<br />
quality assurance and color control for the packaging, labels, folding cartons and<br />
commercial print markets. Today, more than 2,300 PrintVision systems for packaging<br />
and labels automatic inspection are installed worldwide. AVT is headquartered in<br />
Hod-Hasharon/Israel with sales, marketing, and support offices in the United States,<br />
Europe and China. The company is listed in the Prime Standard of the Frankfurt<br />
Stock Exchange. In 1Q<strong>2011</strong> the company posted revenues of USD 10.6m (yoy<br />
+7.6% and QoQ +4.9%. Operating income was USD 0.4m compared to an operating<br />
loss of USD 0.7m in 4Q2010.<br />
Perceptron, Inc. was founded in 1981 as a supplier of high technology, laserbased,<br />
non-contact measurement systems for industrial manufacturers to reduce process<br />
variation that occurs in the manufacturing process. Today Perceptron has two diverse<br />
lines of business the Industrial Business Unit and the Commercial Products Business<br />
Unit. The company has traditionally a strong market position in automotive industry<br />
but has been expanding business to new market verticals over the last year(s).<br />
<strong>AUGUST</strong>A Technologies <strong>AG</strong> operates in the niche markets of digital imaging (Vision)<br />
and sensing (Sensors & Microsystems Technology). The Group activities are<br />
organized within the business segments Vision and Sensors. In Vision segment the<br />
company focuses on the end market of industrial cameras for various applications.<br />
Although the company currently generates ~60% of its revenues in Sensor business<br />
<strong>AUGUST</strong>A has clear strategic focus on Vision business targeting to become a<br />
leading Vision player in the mid-term. In FY2010 the company generated sales of<br />
<strong>EUR</strong> 45.3m in its Vision business with an underlying EBIT margin of 23.4%.<br />
Founded in 1988, Basler with its approximately 250 employees generated a turnover<br />
of <strong>EUR</strong> 51m in FY 2010. This makes Basler one of the largest companies in vision<br />
technology. The headquarters of the company is located in Ahrensburg near<br />
Hamburg. In the field of digital, industrial cameras, Basler is among the Top-3 players<br />
worldwide. Apart from cameras the company also provides inspection systems for<br />
display glass which however is not considered as a strategic business going forward.<br />
Peer group valuation<br />
In order to derive the fair value of the company, we applied the median of different<br />
multiples to our peer group analysis. The table on the next page summarizes the<br />
multiples of the relevant peers. However in interpreting the multiples, it is worth to<br />
note the different treatment of capitalization of development costs between IFRS and<br />
US GAAP which leads to different multiples. Under IFRS companies are allowed to<br />
capitalize R&D expenses (only development costs) while under US GAAP a<br />
capitalization is still prohibited. Thus at initial period the capitalization results in higher<br />
margins for companies reporting under IFRS. However like other assets the<br />
capitalized development costs must be written down over a certain period which<br />
results in higher amortization expenses. Overall we believe EV/EBIT and P/E are<br />
better proxies for comparing MV peers even though we also applied EV/EBITDA<br />
multiple in our peer group valuation.<br />
www.cbseydlerresearch.ag<br />
...AVT...<br />
...Perceptron...<br />
...<strong>AUGUST</strong>A...<br />
...Basler<br />
We applied different<br />
multiples<br />
Close Brothers Seydler Research <strong>AG</strong> | 9
<strong>ISRA</strong> <strong>VISION</strong> <strong>AG</strong><br />
Peer group multiples<br />
Company name<br />
Source: Bloomberg, CBS Research <strong>AG</strong><br />
The derived multiples represent a relatively wide range. Not surprisingly Cognex is<br />
traded with higher multiples which are justified by company´s higher margins as well<br />
as outstanding market position.<br />
Based on P/E and Enterprise value multiples such as EV/EBIT and EV/EBITDA<br />
multiples for the years 10/11E-11/12E we derived a fair value of <strong>EUR</strong> 22.52 for the<br />
company. We applied the median of the peer group multiples to our financial<br />
forecasts to derive a fair value of the company. We weight the peer group valuation<br />
with 30% in our overall valuation approach given the limited comparability of business<br />
models among the peers.<br />
Peer group valuation<br />
Source: Bloomberg, CBS Research <strong>AG</strong><br />
www.cbseydlerresearch.ag<br />
P/E EV/EBITDA<br />
EV/EBIT<br />
10/11E 11/12E 12/13E 10/11E 11/12E 12/13E 10/11E 11/12E 12/13E<br />
COGNEX CORP 20.9 18.2 - 12.1 11.0 - 14.9 12.3 -<br />
ADVANCED <strong>VISION</strong> TECHNOLOGY 13.2 9.7 8.0 - - - 7.4 5.1 3.6<br />
ORBOTECH LTD 7.5 7.1 - - - - 2.9 2.5 -<br />
PERCEPTRON INC n.m. 25.5 - 12.6 7.7 - 20.8 10.1 -<br />
BASLER <strong>AG</strong> 11.6 10.4 8.8 3.0 2.9 2.5 5.8 5.5 4.8<br />
<strong>AUGUST</strong>A TECHNOLOGIE <strong>AG</strong> 8.2 6.5 5.8 4.8 4.0 3.6 5.9 4.7 4.2<br />
Average 12.3 12.9 7.5 8.1 6.4 3.1 9.6 6.7 4.2<br />
Median 11.6 10.0 8.0 8.4 5.8 3.1 6.6 5.3 4.2<br />
Peer analysis results in<br />
fair value of <strong>EUR</strong><br />
22.52/share<br />
EPS EBITDA<br />
EBIT<br />
<strong>EUR</strong>m, except EPS (<strong>EUR</strong>) 10/11E 11/12E 12/13E 10/11E 11/12E 12/13E 10/11E 11/12E 12/13E<br />
<strong>ISRA</strong> Vision <strong>AG</strong>: Financial estimates CBS Research 2.06 2.39 2.64 20.89 23.21 24.86 13.83 15.77 17.30<br />
Applied multiples: Peer group median 11.6 10.0 8.0 8.4 5.8 3.1 6.6 5.3 4.2<br />
Enterprise value (derived) - - - 175.9 135.2 76.5 91.8 83.2 72.9<br />
+ Net debt -26.9<br />
Market capitalisation (derived) 103.4 103.7 - 148.9 108.3 - 64.9 56.3 -<br />
Average 97.6<br />
Premium (discount) vs. Peer Group 0%<br />
Fair market capitalisation 97.6<br />
Number of shares (m) 4.33<br />
Fair value per share (<strong>EUR</strong>) 22.52<br />
Close Brothers Seydler Research <strong>AG</strong> | 10
<strong>ISRA</strong> <strong>VISION</strong> <strong>AG</strong><br />
MV Technology and Industry<br />
Machine vision (MV) refers to the application of vision technology, which is an electro<br />
optical system (i.e. camera) connected to a processing unit, such as a computer, for<br />
image processing and to control a system. It combines hardware and software to a<br />
vision system that can "see" a target object and deliver information to the user. The<br />
data is recorded by a camera and analyzed by a computer, which filters out the<br />
relevant information and passes on the previously specified results to the control unit,<br />
which then can responds accordingly.<br />
An example of MV System<br />
Camera<br />
+<br />
Sensor<br />
Target object<br />
Source: Cognex, CBS Research <strong>AG</strong><br />
Products in MV technology are separated in two main categories Vision Systems and<br />
Vision Components. Although a Vision System can have a variety of physical forms,<br />
depending on the user‟s needs, in its basic form it comprises the following<br />
components 1) one or more digital cameras for acquiring images 2) a sensor for part<br />
detection to trigger image acquisition and processing 3) a software program to<br />
process images (i.e. detect, measure, compare) in order to check whether or not a<br />
quality criteria has been met or to provide type verification or robot control to another<br />
control system 4) interfaces (i.e. digital I/O) or communication links (e.g. Industrial<br />
Ethernet) to report results.<br />
Components of a MV system<br />
Architectures<br />
� PC + camera<br />
�Embedded Vision<br />
�Smart camera<br />
�PC+Smart camera<br />
Optics<br />
�Lenses<br />
�Prisms & Beam splitters<br />
�Color filters<br />
�Polarizers<br />
Processors<br />
�FPGA<br />
�DSP<br />
�RISC<br />
�Frame Grabbers<br />
Source: Frost & Sullivan, CBS Research <strong>AG</strong><br />
The placement of the lighting and the quality of the optics (lens) affects the quality of<br />
the image. Thus they are critical in creating the contrast required for the inspection<br />
system to distinguish features in the object under inspection. While the camera and<br />
www.cbseydlerresearch.ag<br />
Interface<br />
Software<br />
� Identification<br />
� Measurement<br />
� Guidance/Other<br />
Mashine Vision<br />
&<br />
Factory Automation<br />
Interfaces<br />
�Gigabit Ethernet (GigE)<br />
�Firewire<br />
�CameraLink<br />
�USB 2.0<br />
Computer System<br />
+<br />
Software<br />
Assembly line<br />
� CMOS<br />
�CCD<br />
�Others<br />
�Analog<br />
�Digital<br />
Sensors<br />
Data capture<br />
Spectrum/Illumination<br />
�Visible<br />
�Infrared (IR)<br />
�Ultraviolet<br />
�LED, Other<br />
A technology of<br />
“artificial seeing”<br />
Structure of machine<br />
vision system<br />
Technological features<br />
Close Brothers Seydler Research <strong>AG</strong> | 11
<strong>ISRA</strong> <strong>VISION</strong> <strong>AG</strong><br />
the sensor are critical components of a MV system in terms of quality of the picture,<br />
software allows analyzing the captured data and delivering relevant decision making<br />
information to the management.<br />
Traditionally MV systems are mainly utilized in industries with highly automated<br />
manufacturing processes and high quality requirements (i.e. automotive,<br />
semiconductor, glass etc). Thus a vision system requires expertise in various<br />
technological fields delivering following benefits to the end users 1) enabling higher<br />
degree of automation in industrial manufacturing, 2) improving quality and yield in the<br />
production/manufacturing, 3) delivering cost saving potentials and 4) providing a<br />
sound data basis for the optimization of production and workflow processes.<br />
<strong>ISRA</strong>´s market position in the value chain<br />
The machine vision industry is highly fragmented and consists of various number of<br />
market players which focus on different areas of the value chain. Most market players<br />
can be categorized into MV component manufacturers, MV system suppliers and<br />
integrators. Usually a system supplier integrates various components into a MV<br />
system, which is then embedded into the end users manufacturing/production lines.<br />
In the following chart we summarized some of the major market players positioned in<br />
different parts of the MV value chain. However it is worth to note that there is a large<br />
number of non-listed market players with revenues below <strong>EUR</strong> 5.0m that focuses on<br />
specific niches and markets.<br />
Overview vision market players<br />
Camera and other hardware<br />
components<br />
MV sensor products<br />
Source: <strong>ISRA</strong> <strong>VISION</strong>, CBS Research <strong>AG</strong>, * It is worth to note that there is a large number of non-listed small players<br />
with revenues below the <strong>EUR</strong> 5.0m mark<br />
<strong>ISRA</strong> <strong>VISION</strong> is positioned in the MV value chain as a system supplier holding a<br />
leading market position in surface inspection and 3D robot guidance. The company<br />
focuses on high-end application standard products and complex generic standard<br />
products. While some component manufactures also offer to certain degree simple<br />
machine vision solutions, in most cases, however, they are usually suppliers of<br />
system providers such as <strong>ISRA</strong>. However, MV system providers often offer more<br />
complex applications with software solutions for the relevant applications that are not<br />
easy to imitate.<br />
In our view the current technological requirements such as higher data rates and<br />
greater real time image processing allow component suppliers (i.e. camera and<br />
sensor providers) to capture a significant part of the value-add delivered by a MV<br />
technology. However, going forward, we think that the application expertise, the<br />
knowledge of the customers´ production processes, the flexibility of the MV system<br />
and greater/autonomous robotic capabilities will be the factors favoring the business<br />
www.cbseydlerresearch.ag<br />
Sony Electronics, Augusta Technologies <strong>AG</strong>, BASLER <strong>AG</strong>, DALSA, PixeLINK,<br />
JAI, Graftek Imaging<br />
Sony Electronics, Cognex Inc, SICK inc, LMI Technologies, DALSA, Panasonic,<br />
Omron<br />
Vision based robot guidance Cognex, <strong>ISRA</strong> <strong>VISION</strong>, Adept Technologies<br />
MV Software/Video analytics Omron, MVTec Software GmbH, Stemmer, NeuroCheck GmbH<br />
MV Systems/solutions<br />
Application Specific standard products: <strong>ISRA</strong> <strong>VISION</strong>, AVT, BASLER <strong>AG</strong> (non<br />
strategic business), Cognex, Dr. Schenck, ORBOTECH, Vitronic, Perceptron, etc.<br />
Generic standard products: <strong>ISRA</strong> <strong>VISION</strong>, Cognex, Keyence, SICK, Matsushita,<br />
etc.<br />
Benefits of a MV<br />
system<br />
Market players can be<br />
subdivided into system<br />
and component<br />
suppliers<br />
<strong>ISRA</strong> is a leading MV<br />
system supplier<br />
From mid-term<br />
perspective we prefer<br />
MV system suppliers<br />
Close Brothers Seydler Research <strong>AG</strong> | 12
<strong>ISRA</strong> <strong>VISION</strong> <strong>AG</strong><br />
models of system suppliers such as <strong>ISRA</strong> <strong>VISION</strong>. Thus we consider systems<br />
suppliers such as <strong>ISRA</strong> more favorably positioned to capture a higher proportion of<br />
the value-add going forward. Particularly their 1) direct access to the users and 2)<br />
application/industry specific engineering expertise will put them into a competitive<br />
position to deliver its customers the desired cost saving and quality improvements<br />
(i.e. a faster amortization of the investment in a MV system). As the MV industry and<br />
technology continues to progress we assume components (i.e. cameras and<br />
sensors) to turn into a commodity business in traditional MV application areas.<br />
The Company: Pioneer in MV<br />
<strong>ISRA</strong> <strong>VISION</strong> is a pioneer in Machine Vision industry. The company offers a broad<br />
product range focusing on the technologies for 1) surface vision, 2) robot vision for<br />
automated robot guidance and 3) quality vision. Apart from some components (e.g.<br />
frame grabbers, LED modules) the company sources the main hardware components<br />
of its systems from different suppliers which are then assembled in-house and<br />
integrated into the end users manufacturing and production lines. The key value-add<br />
delivered by the company is the BrainWare® which integrates the company´s broad<br />
application expertise and different technologies into an advanced software system for<br />
standard application in the industry.<br />
Business Overview<br />
Source: <strong>ISRA</strong> <strong>VISION</strong>, CBS Research <strong>AG</strong><br />
The company has currently more than 440 employees serving a global customer<br />
base from 20 different locations worldwide. The company´s customers are mostly<br />
blue-chip companies that undertake investments in MV systems to 1) cut costs, 2)<br />
improve quality and 3) maximize yield.<br />
History<br />
INDUSTRIAL AUTOMATION<br />
�Automotive<br />
End markets<br />
<strong>ISRA</strong> was founded by the current Chief Executive Officer and shareholder Enis Ersü<br />
and other experts in robotics and image processing at the Technical University of<br />
Darmstadt in 1985. The company went public in 2000 at the German New Market<br />
and the new company name became <strong>ISRA</strong> <strong>VISION</strong> <strong>AG</strong>. SRA Vision acquired<br />
multiple companies in the machine vision industry and opened up offices outside of<br />
Germany to expand the sales markets and customer service & support. In November<br />
2009 <strong>ISRA</strong> <strong>VISION</strong> acquired a minority stake in the Turkish company VISTEK, to<br />
expand its market position in Turkey as well as in the Middle-East and Central Asia.<br />
<strong>ISRA</strong> <strong>VISION</strong> furthermore acquired Graphikon, a German machine vision system<br />
supplier well-known for its inspection systems for the solar manufacturing industry.<br />
www.cbseydlerresearch.ag<br />
�Glass<br />
� Metal<br />
�Paper<br />
Pioneer in Machine Vision: Broad product range for automating both quality inspection and production<br />
Focusing on different<br />
technologies<br />
SURFACE Vision<br />
End markets<br />
Glass<br />
Pioneer in MV<br />
� Print<br />
� Plastics<br />
� Solar<br />
Close Brothers Seydler Research <strong>AG</strong> | 13
<strong>ISRA</strong> <strong>VISION</strong> <strong>AG</strong><br />
With the acquisition, <strong>ISRA</strong> <strong>VISION</strong> aims to strengthen its position in this fast growing<br />
industry.<br />
Company Structure<br />
<strong>ISRA</strong> <strong>VISION</strong> <strong>AG</strong> is the holding company of the group and is located in Darmstadt in<br />
Germany, where the central departments finance, R & D, marketing, purchase and<br />
electro-production are concentrated. Currently, the company has subsidiaries in nine<br />
countries and offices on different continents. <strong>ISRA</strong> <strong>VISION</strong> <strong>AG</strong> in Darmstadt in<br />
Germany is the Industrial Automation business unit, while <strong>ISRA</strong> SURFACE <strong>VISION</strong><br />
GmbH in Herten in Germany is operating in the Surface Vision segment. Apart from<br />
the German subsidiaries the company has set up various international units serving<br />
its customers from 20 different locations.<br />
The eight markets where <strong>ISRA</strong> <strong>VISION</strong> is currently operative are divided between the<br />
business segments. The automotive industry falls under the Industrial Automation<br />
business unit, the other markets are within the Surface Vision division. The industry<br />
markets currently covered by Surface Vision are: glass, solar, plastics, print, specialty<br />
paper, paper, and metal.<br />
Shareholder Structure<br />
The share capital of <strong>ISRA</strong> <strong>VISION</strong> <strong>AG</strong> equals 4,381,240 shares. With a stake of<br />
25.2% the company´s Chief Executive Officer Enis Ersü is currently <strong>ISRA</strong> <strong>VISION</strong>´s<br />
main single shareholder. <strong>VISION</strong> GbR currently holds another 5% of the company,<br />
the rest being free float.<br />
Shareholder structure<br />
Source: Bloomberg, CBS Research <strong>AG</strong><br />
Management<br />
53.4%<br />
The company‟s management board consists of four members:<br />
Mr. Enis Ersü is the founder and is the Chief Executive Officer of the company. He<br />
successfully transformed the company from a spin-off of the University of Darmstadt<br />
in Germany to one of the international market leading machine vision companies. He<br />
is closely involved with all parts of the organisation and his presence in the machine<br />
vision industry since the early beginning of the vision technology greatly contributes<br />
to the company‟s success.<br />
The other members of the board are Mr. Hans-Jürgen Christ (Vice Chairman and<br />
Sales Manager), Mr. Dr. Johannes Giet (R&D Manager), and Mr. Werner Rothermel<br />
(Production Manager).<br />
www.cbseydlerresearch.ag<br />
25.2%<br />
10.0%<br />
5.0%<br />
3.3%<br />
3.1%<br />
Enis Ersü (CEO)<br />
Fidelity<br />
Vision GbR<br />
Argos Investment<br />
DWS Investment<br />
Free float<br />
National and<br />
international operating<br />
business units<br />
CEO is main single<br />
shareholder<br />
Enis Ersü, the driving<br />
force behind <strong>ISRA</strong><br />
<strong>VISION</strong><br />
Close Brothers Seydler Research <strong>AG</strong> | 14
<strong>ISRA</strong> <strong>VISION</strong> <strong>AG</strong><br />
Business Model<br />
<strong>ISRA</strong> <strong>VISION</strong> <strong>AG</strong> operates through two business divisions, namely Surface Vision,<br />
which counts for ~80% of the total revenues, and Industrial Automation, which makes<br />
up the remaining 20%. <strong>ISRA</strong> <strong>VISION</strong> currently serves eight different industries of<br />
which automotive falls under the in Industrial Inspection segment (i.e. robot vision<br />
and quality vision) while the rest is consolidated within the Surface Vision division. In<br />
all market verticals the company offers a broad range of systems and solution to<br />
optimize the manufacturing processes of its customers and to reduce costs. Thus the<br />
company´s MV systems provide an attractive return on investment for the customers<br />
(i.e. a swift amortization of their investments within the first six months).<br />
Overview business divisions<br />
Industrial<br />
Automation<br />
Automotive<br />
Source: <strong>ISRA</strong> <strong>VISION</strong>, CBS Research <strong>AG</strong><br />
Although supplying many industries, <strong>ISRA</strong> generates the core of its revenues in the<br />
end markets Glass (~25%), Metals (~23%), Plastic (~18%) and Automotive (~18%)<br />
where the company has build up a leading market position over the last years. While<br />
<strong>ISRA</strong> is traditionally strong in industries with a high degree of automated production<br />
and high quality requirements, the company is expanding the business into new<br />
market verticals such as Solar, Healthcare and Food.<br />
Overview end markets and customers<br />
Source: <strong>ISRA</strong> <strong>VISION</strong>, CBS Research <strong>AG</strong><br />
In most of its end markets, <strong>ISRA</strong> ranks among the top three system suppliers and<br />
has longstanding business relations with market leaders of the relevant industries.<br />
Particularly in the end markets Glass (market share ~85%), Metals (~60%) and<br />
Automotive (~30%) the company holds a leading market position.<br />
<strong>ISRA</strong> serves mainly internationally operating conglomerates that require MV system<br />
for various steps in their manufacturing processes. The price range for the<br />
company´s systems can vary significantly (details chart below) depending on the<br />
market vertical and technological requirements. In all market verticals, the company<br />
competes with different players which we have summarized in the chart below.<br />
Cognex seems to be the company main competitor as it targets similar verticals.<br />
www.cbseydlerresearch.ag<br />
Glass<br />
Sales FY09/10: <strong>EUR</strong> 11.5m<br />
EBIT Margin FY09/10: 16.3%<br />
Surface Vision<br />
Solar Plastics Print<br />
Specialty<br />
Paper<br />
Sales FY09/10: <strong>EUR</strong> 53.3m<br />
EBIT FY09/10: 18.0%<br />
Paper Metal<br />
Glass/Display Metals Plastic Automotive<br />
Two business division<br />
Dominant market<br />
position in some<br />
industries<br />
Paper<br />
(incl. Speciality)<br />
Revenue contribution 21% 25% 18% 16% 14% 6%<br />
Market share >80% 60-65% >30% 30% >25% 7-10%<br />
Leading market<br />
position in some<br />
industries...<br />
Print<br />
...depending on market<br />
verticals changing<br />
prices and competitors<br />
Close Brothers Seydler Research <strong>AG</strong> | 15
<strong>ISRA</strong> <strong>VISION</strong> <strong>AG</strong><br />
Overview of competition and prices<br />
Price range of MV System<br />
(in 1,000 <strong>EUR</strong>)<br />
Source: <strong>ISRA</strong> <strong>VISION</strong>, CBS Research aG<br />
Once <strong>ISRA</strong> gains access to a potential customer the company aims to deliver its<br />
systems into the client‟s various manufacturing processes of the client. Thus<br />
customer retention and customer service are key strategic cornerstones of the<br />
Group´s business strategy. Along with direct access to end customers (i.e. key<br />
account management), <strong>ISRA</strong> also provides an outstanding service with international<br />
customer support service centers located in 20 different locations. In our view this is<br />
one of <strong>ISRA</strong>´s main competitive advantages over most of its competitors which are<br />
mostly operating on local level focusing only certain industries.<br />
Surface Vision<br />
In the Surface Vision segment <strong>ISRA</strong> offers a full range of products from a broadly<br />
diversified array of standard products to customized machine vision solutions based<br />
on application-specific standard products. <strong>ISRA</strong> claims to be the global market leader<br />
in Surface Vision systems, serving various industries with its systems and solutions.<br />
The company´s MV systems are able to perform a 100% inspection of surfaces on<br />
materials such as metal, paper, glass, foils and film, nonwovens and other printed<br />
materials (even in color), seeking out and detecting defects or quality mismatches.<br />
A key value-add delivered by <strong>ISRA</strong> is its modular software platform called EPOMI<br />
(Enterprise Production Management Intelligence) which consists of various modules<br />
(EXPERTs) and is developed in-house. The various modules capture, evaluate and<br />
prioritize the data according to specific questions and generate suggestions for<br />
management decision process. The modules are optional parts of the MV system<br />
and can be purchased by the customers according to their specific needs or<br />
requirements. Overall the software platform bundles the company´s more than 25<br />
years of engineering and application expertise in MV industry.<br />
Along with direct access to end users and global service network, <strong>ISRA</strong> most<br />
remarkable competitive advantage is its broad application expertise allocated over<br />
the last 25 years of being a key player in the machine vision industry. Thus <strong>ISRA</strong> is<br />
able to provide broad engineering expertise in various industries. In our view the<br />
company´s knowledge of the customer production processes and its capability of<br />
continuously aligning its products with the requirements and needs of customers put<br />
<strong>ISRA</strong> into a comfortable competitive position to deliver systems and solutions that<br />
enable its customers a faster amortization time. According to <strong>ISRA</strong>, for a customer<br />
investing in the company´s MV system, the average return on investment is currently<br />
around 6 months. With its latest generation of machines, <strong>ISRA</strong> can deliver an even<br />
faster amortization time.<br />
www.cbseydlerresearch.ag<br />
Glass/Display Metals Plastic Automotive<br />
Paper<br />
(incl. Speciality)<br />
Print Solar<br />
100-300 130-400 60 - 250 15 - 450 100 - 650 50-200 40 - 200<br />
Competition Low Low Medium Medium High High High<br />
Key Competitiors<br />
Dr. Schenk,<br />
Kubotek<br />
COGNEX<br />
VAI<br />
COGNEX<br />
Erhardt & Leimer<br />
OCS<br />
Perceptron<br />
Cognex<br />
INOS<br />
VMT<br />
Cognex<br />
ABB<br />
Futec<br />
AVT<br />
BST (Elexis)<br />
Futec<br />
Direct access to<br />
customers<br />
GP Solar<br />
Vitronic<br />
ATM<br />
Dr. Schenck<br />
Delivering value-add<br />
with the software<br />
Application expertise<br />
and direct access to<br />
customers are key<br />
competitive<br />
advantages<br />
Close Brothers Seydler Research <strong>AG</strong> | 16
<strong>ISRA</strong> <strong>VISION</strong> <strong>AG</strong><br />
Industrial Automation<br />
In Industrial Automation <strong>ISRA</strong> equips industrial robots or production lines with the<br />
relevant MV technology (i.e. Hardware and Software) that they can detect work<br />
pieces with precision, identify them individually, and pick them with accuracy. <strong>ISRA</strong>´s<br />
robot guidance solutions deliver sustainable improvement of productivity, quality and<br />
profitability for the customers. Since the company was founded in 1985, the<br />
technology of robot guidance has been one of <strong>ISRA</strong>'s core competencies. Meanwhile<br />
the company is able to provide all core components of the system from one source.<br />
Given the high degree of automation in automotive industry (~60% of the robotics<br />
market) most of <strong>ISRA</strong>´s clients are leading car manufacturers. Additionally, the<br />
company also targets the end markets of machine tool providers, the automation<br />
industry, general industry, plant and system manufacturers as well as OEM markets<br />
in which <strong>ISRA</strong> products are integrated into customers‟ products. However, given the<br />
high degree of customer concentration, the Industrial Automation segment is more<br />
cyclical following the business cycle in the primary automotive industry. However it is<br />
worth to note that automotive manufacturers usually invest in MV systems when they<br />
are in a down-cycle facing cost saving pressure<br />
Although Industrial Automation has been losing ground against the Surface Vision<br />
segment in terms of revenues, it is still a strategic part of <strong>ISRA</strong>´s business model.<br />
Thus <strong>ISRA</strong> continues to invest in Industrial Automation particularly in the area of 3D<br />
Technology. The company is one of the leading providers of 3D machine vision and<br />
robot guidance solutions. <strong>ISRA</strong> has introduced several innovations for 3D<br />
applications and has recently announced a larger frame agreement (double digit<br />
Euro range) with a leading German car manufacturer.<br />
www.cbseydlerresearch.ag<br />
Market leader in 3D<br />
technology<br />
High dependency on<br />
primary automotive<br />
industry<br />
Close Brothers Seydler Research <strong>AG</strong> | 17
<strong>ISRA</strong> <strong>VISION</strong> <strong>AG</strong><br />
Growth strategy<br />
<strong>ISRA</strong> pursues a Multi-Branch strategy based on three core strategic pillars 1)<br />
Technologies, 2) Industries and 3) Regions. With its Multi-Branch strategy <strong>ISRA</strong> aims<br />
to achieve a higher diversification in terms of applications, end customers and<br />
geographies while focusing at the same time on long-term profitable growth. This<br />
allows the company to reduce its sensitivity to regional and industry-specific<br />
fluctuations and hence to allow for more stable business development. For the<br />
upcoming years the management targets revenues that exceed the <strong>EUR</strong> 100m mark.<br />
Strategic pillars<br />
Robot Vision<br />
Source: <strong>ISRA</strong> <strong>VISION</strong>, CBS Research <strong>AG</strong><br />
On the technological side, <strong>ISRA</strong> aims to expand its product portfolio that allows the<br />
company to tap new end markets and applications. The company intends to monetize<br />
on its 25 years technological expertise to invent new products while increasing the<br />
cost-effectiveness of already existing solutions/systems. <strong>ISRA</strong> plans to introduce 25<br />
new products over the next year(s) of which one third was already introduced in the<br />
recent past. The driving force behind company´s new innovations is the intention to<br />
provide systems and solution that allow customers a high return on their MV<br />
investments (i.e. swift amortization) by delivering following benefits 1) cost reduction,<br />
2) quality/yield improvements and 3) higher efficiency in the manufacturing process.<br />
A further the key elements of company´s growth strategy is the expansion of<br />
business activities into new market verticals while strengthening at the same time its<br />
market position in existing end markets. The focus will be on acquiring new<br />
customers by offering both existing products and new innovations that have been<br />
specifically designed for industry/customer specific requirements. Going forward,<br />
<strong>ISRA</strong> intends to tap those industries that 1) will require higher investments in MV<br />
technology and 2) show currently low market penetration. The company considers<br />
particularly the growth prospects in the end markets Energy, Healthcare, Food,<br />
Transportation and Information as attractive. Another cornerstone of <strong>ISRA</strong>´s strategy<br />
is the geographic expansion of its business activities. <strong>ISRA</strong> plans to expand into new<br />
geographic markets and to add sales and distribution channels in those markets that<br />
offer an above average growth rate. The company aims for higher revenue<br />
contribution from business expansion to Asia, Americas and other geographies such<br />
as the Middle East or Eastern Europe in the coming years.<br />
Along with organic growth, acquisitions are another important element in the<br />
company´s growth strategy. Over the last years, <strong>ISRA</strong> <strong>VISION</strong> acquired eight<br />
companies which have been successfully restructured and integrated into the existing<br />
Group structure. Going forward, we expect to see acquisition in those market<br />
verticals that the company has just recently entered or intends to tap (i.e. energy,<br />
food etc).<br />
www.cbseydlerresearch.ag<br />
Surface Vision<br />
Quality Vision<br />
Metal<br />
Industries<br />
Paper<br />
Print<br />
Multi-Branch Strategy<br />
Plastics<br />
Technologies Industries Regions<br />
Glass<br />
Solar<br />
Automotive<br />
Europe<br />
Americas<br />
Aiming for <strong>EUR</strong> 100m<br />
top line in the mid-term<br />
Asia<br />
New product launches<br />
Tapping new market<br />
verticals ....<br />
...and geographies<br />
Acquisitive growth<br />
Close Brothers Seydler Research <strong>AG</strong> | 18
<strong>ISRA</strong> <strong>VISION</strong> <strong>AG</strong><br />
MV Market<br />
The breakthrough of machine vision came in the 1980s and the industry has been<br />
growing ever since. Due to increasing complex solutions and ongoing developments<br />
as well as higher demanded quality and efficiency, more applications are becoming<br />
suitable and interesting for machine vision technology. The global machine vision<br />
market declined in 2009 as a result of the global economic crisis. Companies delayed<br />
their investments in new machines and production facilities, resulting in less demand<br />
for machine vision products.<br />
According to the VDMA, the global machine vision market has recovered from the<br />
lows in 2009 and was worth <strong>EUR</strong> 7.5bn in 2010. Asia Pacific is the largest market for<br />
the machine vision industry with a market share of 35%. The North American region<br />
follows with a share of 31% (VDMA, 2010).<br />
Global Machine Vision market<br />
Source: VDMA, CBS Research <strong>AG</strong><br />
Research firm Markets and Markets reports similar figures estimating the total global<br />
machine vision market to be worth USD 9.83bn in 2010 (Markets and Markets, <strong>2011</strong>).<br />
The market is forecasted to grow at a C<strong>AG</strong>R of 9.3% from 2010–2015 to USD 15.3bn<br />
in 2015. The Asia Pacific region is expected to post highest growth with a C<strong>AG</strong>R of<br />
11.1% from 2010 to 2015. The camera & smart camera market will be the largest<br />
growing market and will be the second largest in terms of revenues, with a 27.3%<br />
share of the total revenues. The optics, lighting and frame grabbers have the largest<br />
share of the total revenue. The processor, camera and hardware market is expected<br />
to grow to USD 3.6bn, at a C<strong>AG</strong>R of 8.8% from 2010 to 2015 (Market and Markets,<br />
<strong>2011</strong>).<br />
European machine vision market<br />
www.cbseydlerresearch.ag<br />
Other Regions<br />
5%<br />
North America<br />
31%<br />
Asia<br />
35%<br />
Europe<br />
29%<br />
Global MV market value: <strong>EUR</strong> 7.5bn<br />
Due to the global recession, European machine vision companies saw a turnover<br />
decline of 21% in 2009, compared to the record year of 2008. However post<br />
recession the demand for machine vision technology has recovered substantially,<br />
resulting in double digit growth rates in 2010. According to European Machine Vision<br />
Association (EMVA) the total turnover for European companies increased by 35% to<br />
<strong>EUR</strong> 1.1bn compared to the previous year. Sales to Asia increased the most in 2010<br />
with a growth rate of 62%. Sales to the American region followed in terms of growth<br />
rates, as the market grew 46% compared to 2009 (EMVA, <strong>2011</strong>). However it is worth<br />
to note that the report of the EMVA is based on the data of 225 European machine<br />
vision companies.<br />
A growing industry<br />
Global market size<br />
<strong>EUR</strong> 7.5bn<br />
Global MV market<br />
expected to grow at<br />
C<strong>AG</strong>R 9.3% over the<br />
period 2010-15E<br />
Post recession a 35%<br />
growth for European<br />
MV industry<br />
Close Brothers Seydler Research <strong>AG</strong> | 19
<strong>ISRA</strong> <strong>VISION</strong> <strong>AG</strong><br />
Change in turnover of European MV companies<br />
80%<br />
60%<br />
40%<br />
20%<br />
0%<br />
-20%<br />
-40%<br />
Source: EMVA, CBS Research <strong>AG</strong><br />
In 2010, all of the different product types showed double digit growth rates, whereby<br />
the camera sales grew the strongest at a rate of 61%. The largest single contributor<br />
to the total machine vision sales is the segment „smart cameras/compact systems &<br />
vision sensors‟. The combined vision components made up 45.3% of the total<br />
machine vision sales in 2010, coming from a 40.6% share in 2009. This strong share<br />
increase is the result of the 50.5% sales increase of the vision components segment<br />
in 2010.<br />
EMVA expects the European machine vision market to grow 20% in <strong>2011</strong> and<br />
thereby to overtake the record year of 2008. Growth per region in <strong>2011</strong> for European<br />
machine vision companies is presented in the graph below.<br />
Growth per region in <strong>2011</strong> for European machine vision companies<br />
25.0%<br />
20.0%<br />
15.0%<br />
10.0%<br />
5.0%<br />
0.0%<br />
Total Sales Europe Asia Americas Other Regions<br />
20.0%<br />
Source: EMVA, CBS Research <strong>AG</strong><br />
MV technology is considered as a key technology in the area of automation,<br />
production control and quality assurance which drove the growth in the past. As can<br />
be seen in the table below, the manufacturing sectors are dominating. The market<br />
share of non-manufacturing applications declined to 10% in 2010, since sales in this<br />
segment stagnated in the same year. However, the non-manufacturing segment<br />
became more important in the last couple of years and is expected to face strong<br />
growth rates in the coming years. The automotive industry became the largest market<br />
in terms of revenues, and the sector saw a strong sales increase of 61.3%. The<br />
largest growth rate is seen in electrical/electronic machines, equipment or devices<br />
applications.<br />
www.cbseydlerresearch.ag<br />
22.0%<br />
18.0%<br />
19.0%<br />
21.0%<br />
Total Sales Europe Asia Americas Other<br />
Regions<br />
2008-2009<br />
2009-2010<br />
Camera market posted<br />
highest growth in 2010<br />
European MV market<br />
expected to grow at<br />
20% in <strong>2011</strong>E<br />
Close Brothers Seydler Research <strong>AG</strong> | 20
<strong>ISRA</strong> <strong>VISION</strong> <strong>AG</strong><br />
Customer of European MV suppliers*<br />
Source: EMVA, * *Sales of machine vision components are not included; **Document Processing,<br />
Entertainment, Intelligent Traffic Systems, Logistics & Postal Sorting, Microscopy & Life Sciences, Security &<br />
Surveillance, Military & Defense<br />
Despite the importance of MV in automated production, according to Frost & Sullivan<br />
non-industrial application such as precision farming, criminology and forensics,<br />
medical engineering and innovative approaches to human-machine-interaction are<br />
key areas where machine vision solutions will make a significant contribution in the<br />
future. Particularly the trend within the machine vision industry towards 3D<br />
technology has started to open up new areas of applications outside of<br />
manufacturing.<br />
Technological Roadmap<br />
Source: Frost & Sullivan<br />
www.cbseydlerresearch.ag<br />
2009 2010<br />
Sales Change<br />
Automotive 15.7% 20.5% 61.3%<br />
Container/Packaging 16.4% 16.4% 23.4%<br />
Food 1.8% 1.3% -6.4%<br />
Glass 7.5% 6.8% 11.4%<br />
Metal 6.5% 5.3% 0.0%<br />
Pharmaceuticals and Cosmetics 6.4% 7.5% 44.9%<br />
Rubber and Plastic 4.6% 4.6% 24.4%<br />
Printing 2.1% 1.9% 6.9%<br />
Electrical/Electronic Machines, Equipment<br />
or Devices (excl. semiconductors) 6.5% 9.6% 82.2%<br />
Semiconductors 4.6% 3.4% -7.5%<br />
Medical Devices 2.9% 3.3% 43.6%<br />
Wood and Paper 7.3% 6.4% 8.8%<br />
Other Manufacturing Sectors 5.3% 3.0% -28.8%<br />
Manufacturing Sectors: 87.6% 90.0% 27.1%<br />
Non-Manufacturing Sectors**: 12.4% 10.0% -0.2%<br />
Total 100.0% 100.0% 23.7%<br />
Components<br />
Influence on<br />
manufacturing<br />
Robotics<br />
Shares of total turnover<br />
2009 2014 2015 2020<br />
� Analog cameras will be replaced by digital<br />
� The need for frame grabbers will decrease<br />
� CMOS Sensors will gain advantage over<br />
CCDS due to lower power consumtion, lower<br />
price and high speed<br />
� High accuracy measurement in 3D and real time<br />
� MV will aid statistical analysis, diagnostics and<br />
maintenance in factories<br />
� Remote control and monitoring of MV systems will<br />
be common<br />
Non-manufacturing<br />
industries will grow<br />
faster going forward<br />
� Embedded, Industry-oriented systems will replace PC-based<br />
systems<br />
� Old-to-new technology replacements (higher sensor<br />
resolution and capture speed<br />
� Multi-spectral sensors will go closer to long IR wavelengths<br />
(~8 microns) and will be limited by lens materials<br />
� Industrial vision systems will become indispensable<br />
part of flexible automation<br />
� MV systems will aid rapid manufacturing<br />
� MV systems will find saftey application in factories<br />
� Vision guided robots will decrease cycle time � Cycle time of vision guided robots shall fall<br />
below 1 second enabling flexible and fast robot operations<br />
� Visual servoing will enable robots to aid flexible precision<br />
machining and other operations<br />
Close Brothers Seydler Research <strong>AG</strong> | 21
<strong>ISRA</strong> <strong>VISION</strong> <strong>AG</strong><br />
Financial review<br />
<strong>ISRA</strong> <strong>VISION</strong> has experienced an impressive growth since the IPO in 2000 (i.e. top<br />
line C<strong>AG</strong>R of 15.3%) through organic as well as acquisitive growth. In recent past<br />
(period FY06/07-09/10 with financial year ending in 30 September) sales growth has<br />
slowed down to a C<strong>AG</strong>R of 8.2% from <strong>EUR</strong> 51.3m to <strong>EUR</strong> 64.8m in FY09/10. While<br />
sales in Surface Vision segment experienced a steady growth of C<strong>AG</strong>R of 12.9% to<br />
<strong>EUR</strong> 53.3m, the Industrial Inspection business was showing a declining trend with<br />
sales dropping to <strong>EUR</strong> 11.5m from <strong>EUR</strong> 14.2m in FY06/07. With exception of<br />
FY08/09, which was affected by global economic crises, <strong>ISRA</strong> <strong>VISION</strong> was able to<br />
increase gross margin from 50.9% to 52.9% at the end of FY09/10.<br />
Sales and gross margin development<br />
70<br />
60<br />
50<br />
40<br />
30<br />
20<br />
10<br />
0<br />
37.0<br />
50.9%<br />
14.2<br />
Source: <strong>ISRA</strong> <strong>VISION</strong>, CBS Research <strong>AG</strong><br />
After successful acquisition and integration of Parsytec in FY06/07 the company´s<br />
EBITDA and EBIT margins (based on reported IFRS numbers) have improved<br />
significantly from 21.3% and 12.0% to 27.2% and 18.9% in FY08, respectively. Even<br />
during the recession the company was able to keep margins stable while most of its<br />
competitors had to digest a stronger drop in operating margins with some even<br />
posting operating losses. In the bottom line the company has been constantly<br />
running the business with an underlying net margin of > 10% over the period<br />
FY06/07-09/10.<br />
Margin development<br />
55.0%<br />
45.0%<br />
35.0%<br />
25.0%<br />
15.0%<br />
5.0%<br />
-5.0%<br />
Source: <strong>ISRA</strong> <strong>VISION</strong>, CBS Research <strong>AG</strong><br />
www.cbseydlerresearch.ag<br />
52.4%<br />
52.4<br />
15.8<br />
51.6%<br />
47.3<br />
52.9%<br />
53.3<br />
10.9 11.5<br />
06/07 07/08 08/09 09/10<br />
Industrial Automation Surface Vision Gross margin<br />
50.9% 52.4% 51.6% 52.9%<br />
21.3%<br />
12.0%<br />
10.0%<br />
27.2% 26.1%<br />
18.9% 15.9% 17.7%<br />
11.1%<br />
11.1%<br />
27.2%<br />
10.7%<br />
06/07 07/08 08/09 09/10<br />
Gross margin EBITDA Margin EBIT margin Net margin<br />
Top line growth of<br />
15.3% since IPO.<br />
53.5%<br />
53.0%<br />
52.5%<br />
52.0%<br />
51.5%<br />
51.0%<br />
50.5%<br />
50.0%<br />
49.5%<br />
Net margins >10%<br />
Close Brothers Seydler Research <strong>AG</strong> | 22
<strong>ISRA</strong> <strong>VISION</strong> <strong>AG</strong><br />
1H FY10/11 results<br />
In the first half of the ongoing FY10/11, ending 31 March <strong>2011</strong>, the company reported<br />
significant yoy top line growth of 20% to <strong>EUR</strong> 32.6m. On operating level, EBIT came<br />
in at <strong>EUR</strong> 6.1m (EBIT margin 18.7%). In Surface Vision sales surged yoy by almost<br />
22% to <strong>EUR</strong> 27.8m with an underlying EBIT margin of 18.6% (vs 1H FY09/10<br />
18.4%). In Industrial Automation division growth pace took place at a much slower<br />
rate, achieving yoy 9% to <strong>EUR</strong> 4.8m. In the bottom line, the company reported net<br />
income of <strong>EUR</strong> 3.9m (net margin 12.0% vs 11% in 1HFY09/10).<br />
At end of May <strong>2011</strong> the company had an order backlog of more than <strong>EUR</strong> 40m.<br />
Furthermore mid of June the company announced a long-term framework agreement<br />
in the double-digit-million euro range with a leading premium automobile<br />
manufacturer in the area of 3D measurement engineering.<br />
For the FY10/11E the company guided a double digit revenue growth to more than<br />
<strong>EUR</strong> 70m and the goal of further improving the margins. From mid-term perspective<br />
the management aims for revenues above the <strong>EUR</strong> 100m mark with stable margin<br />
development.<br />
Forecasts<br />
Based on the Group´s current revenue model Surface Vision and Industrial<br />
Automation, we forecast revenues to grow by a C<strong>AG</strong>R of 11.3% from <strong>EUR</strong> 64.8m to<br />
<strong>EUR</strong> 89.5m over the period FY09/10 to FY12/13E. After years of declining revenues<br />
in Industrial Automation business (-7% over the period 06/07-09/10), we think the<br />
company will successfully turnaround this trend going forward. Considering the<br />
recent order and growing demand for 3D solutions we expect the company´s<br />
Industrial Automation business to grow at C<strong>AG</strong>R of 10.5% over the period FY09/10-<br />
12/13E. In Surface Vision, we expect the double digit growth to continue projecting<br />
revenue growth of C<strong>AG</strong>R 11.5% to <strong>EUR</strong> 73.9m by FY12/13E. Our growth<br />
assumptions are based on 1) business expansion to new market verticals such as<br />
food, healthcare and energy and application areas 2) geographic expansion of<br />
business activities and 3) new product launches attracting new investments in<br />
existing markets.<br />
Segment revenues and margins<br />
Source: CBS Research <strong>AG</strong><br />
www.cbseydlerresearch.ag<br />
09/10 10/11E 11/12E 12/13E C<strong>AG</strong>R<br />
Industrial Automation 11.5 12.6 14.6 15.6 10.5%<br />
EBIT Margin 16.3% 18.1% 18.9% 19.4%<br />
yoy 5.9% 9.6% 15.4% 6.8%<br />
as % of total revenues 18% 17% 17% 17%<br />
Surface Vision 53.3 62.8 69.1 73.9 11.5%<br />
EBIT margin 18.0% 18.4% 18.8% 19.3%<br />
yoy 14.8% 17.8% 10.0% 7.0%<br />
as % of total revenues 82% 83% 83% 83%<br />
Total revenues 64.8 75.4 83.7 89.5 11.3%<br />
yoy 1.7% 16.3% 10.9% 7.0%<br />
Our current estimates are based on standalone business in both segments which<br />
could be topped by potential acquisitions. Considering the company´s business<br />
expansion ambitions to new market verticals, we see good chances to see additional<br />
revenue potential from possible acquisitions, going forward.<br />
Significant growth in<br />
1H FY10/11E<br />
Confident order<br />
backlog<br />
FY10/11E guidance<br />
Double digit top line<br />
C<strong>AG</strong>R going forward<br />
Acquisitive growth<br />
might even accelerate<br />
growth<br />
Close Brothers Seydler Research <strong>AG</strong> | 23
<strong>ISRA</strong> <strong>VISION</strong> <strong>AG</strong><br />
Since we believe MV system suppliers will capture a higher proportion of the valueadd<br />
delivered by MV technology in the future, we expect margin development to be<br />
stable in MV system business. Furthermore, considering <strong>ISRA</strong>´s current product<br />
initiative (~ 25 new systems/solutions), we are positive that <strong>ISRA</strong> should be able to<br />
gradually improve its margins over the next years. Assuming lean cost platform, we<br />
project EBITDA, EBIT and net margin to increase to 27.8%, 19.3% and 12.8%, by<br />
FY12/13E, respectivly.<br />
Overview margins<br />
56.0%<br />
46.0%<br />
36.0%<br />
26.0%<br />
16.0%<br />
6.0%<br />
-4.0%<br />
Source: CBS Research <strong>AG</strong><br />
In recent economic recession the company´s ROE dropped to 7.9%, mainly due to<br />
lower EBIT margin. Going forward we expect ROE to improve gradually to double<br />
digit by FY11/12E which will be driven by higher operating margins as well as lower<br />
debt (i.e. interest burden) and more efficient asset utilization. With ROE above 10%<br />
<strong>ISRA</strong> should be able to offer one of the highest return on equity within the MV<br />
industry.<br />
Decomposition of ROE*<br />
Source: CBS Research <strong>AG</strong>, * Balance sheet numbers based on average numbers to eliminate seasonality effects<br />
Balance sheet and cash<br />
AT the end of FY09/10 the company total balance sheet amounted to <strong>EUR</strong> 160.9m<br />
with an underlying equity ratio of 54.8%. With <strong>EUR</strong> 80.4m, half of company‟s assets<br />
comprised intangible assets of which <strong>EUR</strong> 37.3m is goodwill. The major part of the<br />
remaining intangible assets is capitalized development expenses which we expect to<br />
grow at a much slower pace as the underlying asset base has been grown<br />
considerably (<strong>EUR</strong> 28.1m) over the last years resulting resulting in significant annual<br />
amortization expenses. For FY10/11E we expect amortization of R&D expenses to<br />
amount to <strong>EUR</strong> 4.4m (FY09/10 <strong>EUR</strong> 3.8m) compared to new capitalization of R&D<br />
<strong>EUR</strong> 7.7m (FY09/10 <strong>EUR</strong> 7.7m). A further large position in the balance sheet is<br />
current assets which comprises 44% of company‟s total assets. Inventories and trade<br />
receivables are the two main asset classes within the current assets.<br />
<strong>ISRA</strong> currently runs business with a net debt position of <strong>EUR</strong> 26.9m (as of 1H<br />
FY10/11) with interest bearing debt of <strong>EUR</strong> 32.9m. Going forward we expect the<br />
www.cbseydlerresearch.ag<br />
52.9% 53.8% 54.5% 55.1%<br />
27.2% 27.7% 27.7%<br />
27.8%<br />
17.7% 18.3% 18.9% 19.3%<br />
10.7% 12.0% 12.5% 12.8%<br />
09/10 10/11E 11/12E 12/13E<br />
Gross margin EBITDA Margin EBIT margin Net margin<br />
Tax burden X<br />
Interest<br />
burden<br />
X Ebit margin X<br />
Total asset<br />
turnover<br />
X Financial<br />
Leverage<br />
Gradual improvement<br />
in margin<br />
ROE >10%, going<br />
forward<br />
= ROE<br />
08/09 77.7% 89.2% 15.9% 41.0% 1.7 7.9%<br />
09/10 66.0% 92.3% 17.7% 42.8% 1.8 8.3%<br />
10/11E 70.0% 92.9% 18.3% 45.6% 1.8 9.7%<br />
11/12E 70.0% 93.8% 18.9% 48.1% 1.7 10.2%<br />
12/13E 70.0% 94.3% 19.3% 48.9% 1.6 10.3%<br />
Balance sheet inflated<br />
by intangibles<br />
Net debt of 26.9m<br />
Close Brothers Seydler Research <strong>AG</strong> | 24
<strong>ISRA</strong> <strong>VISION</strong> <strong>AG</strong><br />
company to reduce its debt level with scheduled principal payments in the range of<br />
<strong>EUR</strong> 2.2m to <strong>EUR</strong> 2.5m over the next years. Thus we project debt to equity ratio to<br />
decline from 36% (based on only interest bearing debt) in FY09/10 to 28% in<br />
FY12/13E.<br />
Overview Balance sheet<br />
70.1<br />
70.2<br />
90.8<br />
Source: <strong>ISRA</strong> <strong>VISION</strong>, CBS Research <strong>AG</strong><br />
A weak spot of the company´s balance sheet is the high amount of working capital<br />
which is above the industry level. This has lead in the past to a long cash conversion<br />
cycle as result of inefficient working capital management. However this weakness<br />
can be partly explained by company‟s current business approach of being a pure<br />
system supplier (i.e. certain projects revenues are recognized as percentage of<br />
completion method resulting in high amount of receivables till project is finalized and<br />
handed over to the customer) as well as customer composition which mainly<br />
comprising large blue-chip companies. Going forward we think the management will<br />
put higher attention on optimizing working capital. Thus we expect FCF to turn<br />
positive (FY09/10 <strong>EUR</strong>-2.4m) in the future.<br />
www.cbseydlerresearch.ag<br />
FY 09/10 FY 12/13E<br />
88.3<br />
29.2<br />
43.5<br />
Assets Equity and Liabilities<br />
Equity<br />
Current liabilities<br />
Non-current liabilities<br />
93.3<br />
Current assets<br />
94.2<br />
Non-current assets<br />
116.4<br />
32.4<br />
38.7<br />
Assets Equity and Liabilities<br />
Equity<br />
Current liabilities<br />
Non-current liabilities<br />
Current assets<br />
Non-current assets<br />
Anticipating higher<br />
working capital<br />
efficiency<br />
Close Brothers Seydler Research <strong>AG</strong> | 25
<strong>ISRA</strong> <strong>VISION</strong> <strong>AG</strong><br />
Profit and loss account<br />
Source: Company data, CBS Research <strong>AG</strong>,<br />
www.cbseydlerresearch.ag<br />
IFRS <strong>EUR</strong>m 08/09 09/10 10/11E 11/12E 12/13E<br />
Revenues 58.15 64.85 75.44 83.67 89.53<br />
YoY grow th -14.8% 11.5% 16.3% 10.9% 7.0%<br />
Cost of sales -28.17 -30.52 -34.85 -38.10 -40.20<br />
Gross profit 29.99 34.33 40.59 45.58 49.33<br />
as % of revenues 51.6% 52.9% 53.8% 54.5% 55.1%<br />
Selling and Marketing expenses -10.27 -11.52 -13.35 -14.89 -15.85<br />
as % of revenues -17.7% -17.8% -17.7% -17.8% -17.7%<br />
Research and Development expenses -7.70 -8.35 -9.17 -10.21 -11.05<br />
as % of revenues -13.2% -12.9% -12.2% -12.2% -12.3%<br />
General and Administrative expenses -3.78 -3.84 -4.24 -4.70 -5.14<br />
as % of revenues -6.5% -5.9% -5.6% -5.6% -5.7%<br />
Other operating expenses/income 1.02 0.87 0.00 0.00 0.00<br />
as % of revenues 1.8% 1.3% 0.0% 0.0% 0.0%<br />
EBITDA 15.18 17.65 20.89 23.21 24.86<br />
as % of revenues 26.1% 27.2% 27.7% 27.7% 27.8%<br />
Depreciation and Amortization -5.92 -6.17 -7.06 -7.44 -7.57<br />
as % of revenues -10.2% -9.5% -9.4% -8.9% -8.5%<br />
EBIT 9.26 11.49 13.83 15.77 17.30<br />
as % of revenues 15.9% 17.7% 18.3% 18.9% 19.3%<br />
Net financial result -1.00 -0.89 -0.98 -0.91 -0.87<br />
as % of revenues -1.7% -1.4% -1.3% -1.1% -1.0%<br />
EBT<br />
8.26 10.60 12.85 14.86 16.42<br />
as % of revenues 14.2% 16.4% 17.0% 17.8% 18.3%<br />
Income taxes -1.84 -3.60 -3.85 -4.46 -4.93<br />
as % of EBT -22.3% -34.0% -30.0% -30.0% -30.0%<br />
Net income 6.42 7.00 8.99 10.40 11.50<br />
as % of revenues 11.0% 10.8% 11.9% 12.4% 12.8%<br />
Discontinued operations 0.00 0.00 0.00 0.00 0.00<br />
Minorities -0.05 0.05 0.06 0.07 0.07<br />
Net income attributable to shareholders 6.47 6.95 8.93 10.34 11.43<br />
as % of revenues 11.1% 10.7% 11.8% 12.4% 12.8%<br />
Weight. Average of shares outstanding (in m) 4.26 4.30 4.33 4.33 4.33<br />
Earnings per share 1.52 1.62 2.06 2.39 2.64<br />
Close Brothers Seydler Research <strong>AG</strong> | 26
<strong>ISRA</strong> <strong>VISION</strong> <strong>AG</strong><br />
Balance Sheet<br />
Assets<br />
Source: Company Data, CBS Research <strong>AG</strong><br />
www.cbseydlerresearch.ag<br />
IFRS <strong>EUR</strong>m 08/09 09/10 10/11E 11/12E 12/13E<br />
Noncurrent assets 81.2 90.8 92.3 93.3 94.2<br />
as % of total assets 57.3% 56.4% 54.4% 52.3% 50.2%<br />
Intangible assets 71.5 80.4 82.1 83.3 84.3<br />
Property, plant and equipment 2.7 2.8 2.6 2.4 2.3<br />
Financial assets 0.9 1.2 1.2 1.2 1.2<br />
Other assets (incl. deferred taxes) 6.2 6.5 6.5 6.5 6.5<br />
Current assets 60.6 70.1 77.4 85.2 93.5<br />
as % of total assets 42.7% 43.6% 45.6% 47.7% 49.8%<br />
Inventories 15.1 14.1 15.8 17.7 19.0<br />
Trade accounts receivable 37.1 46.9 46.0 47.7 50.1<br />
Other financial assets 1.5 2.1 2.3 2.5 2.7<br />
Other current assets 1.5 0.2 0.2 0.2 0.2<br />
Cash and cash equivalents 5.4 6.8 13.2 17.2 21.5<br />
Total assets 141.8 160.9 169.7 178.5 187.6<br />
Shareholders´ equity and liabilities<br />
Shareholders´ equity 81.2 88.3 96.4 105.9 116.6<br />
as % of total equity and liabilities 57.3% 54.8% 56.8% 59.3% 62.1%<br />
Subscribed capital 4.4 4.4 4.4 4.4 4.4<br />
Reserves 78.2 84.8 92.8 102.3 112.9<br />
Own shares -0.5 -0.9 -0.9 -0.9 -0.9<br />
Accumulated other comprehensive income -1.7 -0.8 -0.8 -0.8 -0.8<br />
Minority interests 0.8 0.8 0.9 0.9 1.0<br />
Noncurrent Liabilities 41.8 43.5 42.2 40.5 38.7<br />
as % of total equity and liabilities 29.4% 27.0% 24.9% 22.7% 20.6%<br />
Pension plans and similiar commitments 1.8 1.9 1.9 1.9 1.9<br />
Financial debt 26.9 23.2 21.9 20.7 19.6<br />
Other long-term financial liabilities (incl. deferred taxes) 13.0 18.4 18.4 17.9 17.3<br />
Current Liabilities 18.9 29.2 31.1 32.1 32.4<br />
as % of total equity and liabilities 13.3% 18.1% 18.3% 18.0% 17.3%<br />
Provisions 0.8 0.8 0.8 0.9 1.0<br />
Tax liabilities 1.9 0.6 1.8 2.5 3.0<br />
Financial debt 2.2 11.3 10.2 8.9 7.4<br />
Other financial liabilities 8.2 9.4 10.4 11.4 12.2<br />
Accounts payable 5.3 7.1 7.9 8.4 8.9<br />
Other current liabilities 0.4 0.0 0.0 0.0 0.0<br />
Total equity and liabilities 141.8 160.9 169.7 178.5 187.6<br />
Close Brothers Seydler Research <strong>AG</strong> | 27
<strong>ISRA</strong> <strong>VISION</strong> <strong>AG</strong><br />
Cash Flow statement<br />
Source: Company Data, CBS Research <strong>AG</strong><br />
www.cbseydlerresearch.ag<br />
IFRS <strong>EUR</strong>m 08/09 09/10 10/11E 11/12E 12/13E<br />
Net income 6.4 7.0 9.0 10.4 11.5<br />
Depreciation and amortization<br />
Change in accruals<br />
5.9 6.2 7.1 7.4 7.6<br />
0.2 -0.2 0.0 0.1 0.1<br />
Income tax payments (incl. changes in deferred taxes) 3.1 4.5 1.2 0.2 -0.2<br />
"Cash flow" 15.7 17.5 17.3 18.2 18.9<br />
Change in accounts receivable<br />
2.0 -10.9 0.8 -1.7 -2.4<br />
Change in inventories 2.2 0.4 -1.6 -1.9 -1.3<br />
Change in other assets 0.0 0.0 -0.1 -0.2 -0.2<br />
Change pension provisions 0.0 0.0 1.0 1.0 0.8<br />
Change in accounts payables -4.5 -0.2 0.9 0.4 0.5<br />
Change in other liabilities 0.0 0.0 1.0 1.0 0.8<br />
Interests (income, expense) 1.0 0.9 1.0 0.9 0.9<br />
Cash flow from operations 16.4 7.7 19.2 16.7 17.2<br />
CAPEX -8.9 -8.3 -8.5 -8.4 -8.4<br />
Investments in financial assets 0.0 -0.2 0.0 0.0 0.0<br />
Investments in acquisitions -1.9 -1.6 0.0 0.0 0.0<br />
Cash flow from investing activities -10.8 -10.2 -8.5 -8.4 -8.4<br />
Net change in interest bearing loans<br />
-9.2 4.7 -2.4 -2.5 -2.7<br />
Payments for acquisition of own shares -0.6 -0.6 0.0 0.0 0.0<br />
Deposits froms ales of own shares<br />
0.6 0.5 0.0 0.0 0.0<br />
Acquisition of minority interests in subsidiaries 0.0 -0.1 0.0 0.0 0.0<br />
Dividend payment -0.6 -0.7 -0.9 -0.9 -0.9<br />
Interests (income, expense)<br />
-1.0 -0.9 -1.0 -0.9 -0.9<br />
Cash flow from financing activities -10.8 3.0 -4.2 -4.3 -4.4<br />
Change in cash and cash equivalents -5.3 0.6 6.4 4.0 4.4<br />
Adjustments to funds caused by exchange rate fluc.<br />
-0.1 0.3 0.0 0.0 0.0<br />
Total change in cash and cash equivalents -5.4 0.9 6.4 4.0 4.4<br />
Cash at the begining of the year 12.5 7.2 8.0 14.4 18.4<br />
Cash and cash equivalents at the end of the period<br />
- Cash and cash equivalents classified as<br />
7.2 8.0 14.4 18.4 22.7<br />
noncurrent asset<br />
Cash and cash equivalents at the end of<br />
1.7 1.2 1.2 1.2 1.2<br />
the period (consolidated balance sheet) 5.4 6.8 13.2 17.2 21.5<br />
Close Brothers Seydler Research <strong>AG</strong> | 28
<strong>ISRA</strong> <strong>VISION</strong> <strong>AG</strong><br />
Research<br />
Schillerstrasse 27 - 29<br />
60313 Frankfurt am Main<br />
Phone: +49 (0)69 – 977 8456-0<br />
Roger Peeters +49 (0)69 -977 8456- 12<br />
Member of the Board Roger.Peeters@cbseydlerresearch.ag<br />
Martin Decot +49 (0)69 -977 8456- 13 Kristina Kardum +49 (0)69 -977 8456- 21<br />
Martin.Decot@cbseydlerresearch.ag Kristina.Kardum@cbseydlerresearch.ag<br />
Rabeya Khan +49 (0)69 -977 8456- 10 Igor Kim +49 (0)69 -977 8456- 15<br />
Rabeya.Khan@cbseydlerresearch.ag Igor.Kim@cbseydlerresearch.ag<br />
Ralf Marinoni +49 (0)69 -977 8456- 17 Manuel Martin +49 (0)69 -977 8456- 16<br />
Ralf.Marinoni@cbseydlerresearch.ag Manuel.Martin@cbseydlerresearch.ag<br />
Enid Omerovic +49 (0)69 -977 8456- 19 Felix Parmantier +49 (0)69 -977 8456- 22<br />
Enid.Omerovic@cbseydlerresearch.ag Felix.Parmantier@cbseydlerresearch.ag<br />
Marcus Silbe +49 (0)69 -977 8456- 14 Veysel Taze +49 (0)69 -977 8456- 18<br />
Marcus.Silbe@cbseydlerresearch.ag Veysel.Taze@cbseydlerresearch.ag<br />
Institutional Sales<br />
Schillerstrasse 27 – 29 25 Dowgate Hill<br />
60313 Frankfurt am Main London EC4R 2GA<br />
Phone: +49 (0)69 – 9 20 54-400<br />
Raimar Bock +49 (0)69 -9 20 54-115<br />
Head of Sales Raimar.Bock@cbseydler.com<br />
Henriette Domhardt +49 (0)69 -9 20 54-137 Rüdiger Eich +49 (0)69 -9 20 54-119<br />
(Austria, Germany) Henriette.Domhardt@cbseydler.com (Germany, Switzerland) Ruediger.Eich@cbseydler.com<br />
Sule Erkan +49 (0)69 -9 20 54-107 Uwe Gerhardt +49 (0)69 -9 20 54-168<br />
(Sales-Support) Sule.Erkan@cbseydler.com (Germany, Switzerland) Uwe.Gerhardt@cbseydler.com<br />
Klaus Korzilius +49 (0)69 -9 20 54-114 Stefan Krewinkel +49 (0)69 -9 20 54-118<br />
(Benelux, Germany) Klaus.Korzilius@cbseydler.com (Execution, UK) Stefan.Krewinkel@cbseydler.com<br />
Markus Laifle +49 (0)69 -9 20 54-120 Bruno de Lencquesaing +49 (0)69 -9 20 54-116<br />
(Execution) Markus.Laifle@cbseydler.com (Benelux, France) Bruno.deLencquesaing@cbseydler.com<br />
Christopher Seedorf +49 (0)69 -9 20 54-110 Janine Theobald +49 (0)69 -9 20 54-116<br />
(Sales-Support) Christopher.Seedorf@cbseydler.com (Germany) Janine.Theobald@cbseydler.com<br />
Bas-Jan Walhof +49 (0)69 -9 20 54-105<br />
(Benelux) Bas-Jan.Walhof@cbseydler.com<br />
www.cbseydlerresearch.ag<br />
Close Brothers Seydler Research <strong>AG</strong> | 29
<strong>ISRA</strong> <strong>VISION</strong> <strong>AG</strong><br />
Disclaimer and statement according to § 34b German Securities<br />
Trading Act (“Wertpapierhandelsgesetz”) in combination with the<br />
provisions on financial analysis (“Finanzanalyseverordnung” FinAnV)<br />
This report has been prepared independently of the company analysed by Close Brothers Seydler Research <strong>AG</strong><br />
and/ or its cooperation partners and the analyst(s) mentioned on the front page (hereafter all are jointly and/or<br />
individually called the „author‟). None of Close Brothers Seydler Research <strong>AG</strong>, Close Brothers Seydler Bank <strong>AG</strong> or<br />
its cooperation partners, the Company or its shareholders has independently verified any of the information given in<br />
this document.<br />
Section 34b of the German Securities Trading Act in combination with the FinAnV requires an enterprise preparing a<br />
security analysis to point out possible conflicts of interest with respect to the company that is the subject of the<br />
analysis.<br />
Close Brothers Seydler Research <strong>AG</strong> is a majority owned subsidiary of Close Brothers Seydler Bank <strong>AG</strong> (hereafter<br />
´CBS´). However, Close Brothers Seydler Research <strong>AG</strong> (hereafter ´CBSR´) provides its research work independent<br />
from CBS. CBS is offering a wide range of Services not only including investment banking services and liquidity<br />
providing services (designated sponsoring). CBS or CBSR may possess relations to the covered companies as<br />
follows (additional information and disclosures will be made available upon request):<br />
a. CBS holds more than 5% interest in the capital stock of the company that is subject of the analysis.<br />
b. CBS was a participant in the management of a (co)consortium in a selling agent function for the issuance of<br />
financial instruments, which themselves or their issuer is the subject of this financial analysis within the last<br />
twelve months.<br />
c. CBS has provided investment banking and/or consulting services during the last 12 months for the company<br />
analysed for which compensation has been or will be paid for.<br />
d. CBS acts as designated sponsor for the company's securities on the basis of an existing designated<br />
sponsorship contract. The services include the provision of bid and ask offers. Due to the designated<br />
sponsoring service agreement CBS may regularly possess shares of the company and receives a<br />
compensation and/ or provision for its services.<br />
e. The designated sponsor service agreement includes a contractually agreed provision for research services.<br />
f. CBSR and the analysed company have a contractual agreement about the preparation of research reports.<br />
CBSR receives a compensation in return.<br />
g. CBS has a significant financial interest in relation to the company that is subject of this analysis.<br />
In this report, the following conflicts of interests are given at the time, when the report has been published: d,f<br />
CBS and/or its employees or clients may take positions in, and may make purchases and/ or sales as principal or<br />
agent in the securities or related financial instruments discussed in this analysis. CBS may provide investment<br />
banking, consulting, and/ or other services to and/ or serve as directors of the companies referred to in this analysis.<br />
No part of the authors compensation was, is or will be directly or indirectly related to the recommendations or views<br />
expressed.<br />
Recommendation System:<br />
Close Brothers Seydler Research <strong>AG</strong> uses a 3-level absolute share rating system. The ratings pertain to a time<br />
horizon of up to 6 months:<br />
BUY: The expected performance of the share price is above +10%.<br />
HOLD: The expected performance of the share price is between 0% and +10%.<br />
SELL: The expected performance of the share price is below 0%.<br />
Recommendation history over the last 12 months for the company analysed in this report:<br />
Date Recommendation Price at change date Price target<br />
<strong>04</strong> August <strong>2011</strong> BUY (Initiation of Coverage) <strong>EUR</strong> 18.00 <strong>EUR</strong> <strong>24.00</strong><br />
Risk-scaling System:<br />
Close Brothers Seydler Research <strong>AG</strong> uses a 3-level risk-scaling system. The ratings pertain to a time horizon of up<br />
to 6 months:<br />
LOW: The volatility is expected to be lower than the volatility of the benchmark<br />
MEDIUM: The volatility is expected to be equal to the volatility of the benchmark<br />
<strong>HIGH</strong>: The volatility is expected to be higher than the volatility of the benchmark<br />
The following valuation methods are used when valuing companies: Multiplier models (price/earnings, price/cash<br />
www.cbseydlerresearch.ag<br />
Close Brothers Seydler Research <strong>AG</strong> | 30
<strong>ISRA</strong> <strong>VISION</strong> <strong>AG</strong><br />
flow, price/book value, EV/Sales, EV/EBIT, EV/EBITA, EV/EBITDA), peer group comparisons, historical valuation<br />
approaches, discounting models (DCF, DDM), break-up value approaches or asset valuation approaches. The<br />
valuation models are dependent upon macroeconomic measures such as interest, currencies, raw materials and<br />
assumptions concerning the economy. In addition, market moods influence the valuation of companies.<br />
The figures taken from the income statement, the cash flow statement and the balance sheet upon which the<br />
evaluation of companies is based are estimates referring to given dates and therefore subject to risks.<br />
These may change at any time without prior notice.<br />
The opinions and forecasts contained in this report are those of the author alone. Material sources of information for<br />
preparing this report are publications in domestic and foreign media such as information services (including but not<br />
limited to Reuters, VWD, Bloomberg, DPA-AFX), business press (including but not limited to Börsenzeitung,<br />
Handelsblatt, Frankfurter Allgemeine Zeitung, Financial Times), professional publications, published statistics, rating<br />
agencies as well as publications of the analysed issuers. Furthermore, discussions were held with the management<br />
for the purpose of preparing the analysis. Potentially parts of the analysis have been provided to the issuer prior to<br />
going to press; no significant changes were made afterwards, however. Any information in this report is based on<br />
data considered to be reliable, but no representations or guarantees are made by the author with regard to the<br />
accuracy or completeness of the data. The opinions and estimates contained herein constitute our best judgment at<br />
this date and time, and are subject to change without notice. Possible errors or incompleteness of the information do<br />
not constitute grounds for liability, neither with regard to indirect nor to direct or consequential damages. The views<br />
presented on the covered company accurately reflect the personal views of the author. All employees of the author's<br />
company who are involved with the preparation and/or the offering of financial analyzes are subject to internal<br />
compliance regulations.<br />
The report is for information purposes, it is not intended to be and should not be construed as a recommendation,<br />
offer or solicitation to acquire, or dispose of, any of the securities mentioned in this report. Any reference to past<br />
performance should not be taken as indication of future performance. The author does not accept any liabil ity<br />
whatsoever for any direct or consequential loss arising from any use of material contained in this report. The report<br />
is confidential and it is submitted to selected recipients only. The report is prepared for professional investors only<br />
and it is not intended for private investors. Consequently, it should not be distributed to any such persons. Also, the<br />
report may be communicated electronically before physical copies are available. It may not be reproduced (in whole<br />
or in part) to any other investment firm or any other individual person without the prior written approval from the<br />
author. The author is not registered in the United Kingdom nor with any U.S. regulatory body.<br />
It has not been determined in advance whether and in what intervals this report will be updated. Unless otherwise<br />
stated current prices refer to the closing price of the previous trading day. Any reference to past performance should<br />
not be taken as indication of future performance. The author maintains the right to change his opinions without<br />
notice, i.e. the opinions given reflect the author‟s judgment on the date of this report.<br />
This analysis is intended to provide information to assist institutional investors in making their own investment<br />
decisions, not to provide investment advice to any specific investor.<br />
By accepting this report the recipient accepts that the above restrictions are binding. German law shall be applicable<br />
and court of jurisdiction for all disputes shall be Frankfurt am Main (Germany).<br />
This report should be made available in the United States solely to investors that are (i) "major US institutional<br />
investors" (within the meaning of SEC Rule 15a-6 and applicable interpretations relating thereto) that are also<br />
"qualified institutional buyers" (QIBs) within the meaning of SEC Rule 144A promulgated by the United States<br />
Securities and Exchange Commission pursuant to the Securities Act of 1933, as amended (the "Securities Act") or<br />
(ii) investors that are not "US Persons" within the meaning of Regulation S under the Securities Act and applicable<br />
interpretations relating thereto. The offer or sale of certain securities in the United States may be made to QIBs in<br />
reliance on Rule 144A. Such securities may include those offered and sold outside the United States in trans actions<br />
intended to be exempt from registration pursuant to Regulation S. This report does not constitute in any way an offer<br />
or a solicitation of interest in any securities to be offered or sold pursuant to Regulation S. Any such securities may<br />
not be offered or sold to US Persons at this time and may be resold to US Persons only if such securities are<br />
registered under the Securities Act of 1933, as amended, and applicable state securities laws, or pursuant to an<br />
exemption from registration.<br />
This publication is for distribution in or from the United Kingdom only to persons who are authorised persons or<br />
exempted persons within the meaning of the Financial Services and Markets Act 2000 of the United Kingdom or any<br />
order made there under or to investment professionals as defined in Section 19 of the Financial Services and<br />
Markets Act 2000 (Financial Promotion) Order 2005 and is not intended to be distributed or passed on, directly or<br />
indirectly, to any other class of persons.<br />
This publication is for distribution in Canada only to pension funds, mutual funds, banks, asset managers and<br />
insurance companies.<br />
The distribution of this publication in other jurisdictions may be restricted by law, and persons into whose possession<br />
this publication comes should inform themselves about, and observe, any such restrictions. In particular this<br />
publication may not be sent into or distributed, directly or indirectly, in Japan or to any resident thereof.<br />
Responsible Supervisory Authority:<br />
Bundesanstalt für Finanzdienstleistungsaufsicht (BaFin, Federal Financial Supervisory Authority)<br />
www.cbseydlerresearch.ag<br />
Close Brothers Seydler Research <strong>AG</strong> | 31
<strong>ISRA</strong> <strong>VISION</strong> <strong>AG</strong><br />
Graurheindorferstraße 108<br />
53117 Bonn<br />
and<br />
Lurgiallee 12<br />
6<strong>04</strong>39 Frankfurt<br />
Schillerstrasse 27 - 29<br />
60313 Frankfurt am Main<br />
www.cbseydlerresearch.ag<br />
Tel.: 0<strong>04</strong>9 - (0)69 - 97 78 45 60<br />
www.cbseydlerresearch.ag<br />
Close Brothers Seydler Research <strong>AG</strong> | 32