Final Report Part III ECHIM Pilot Data Collection Analyses and Dissemination
Part III: ECHIM Pilot Data Collection, Analyses and Dissemination
Part III: ECHIM Pilot Data Collection, Analyses and Dissemination
- No tags were found...

Create successful ePaper yourself
Turn your PDF publications into a flip-book with our unique Google optimized e-Paper software.
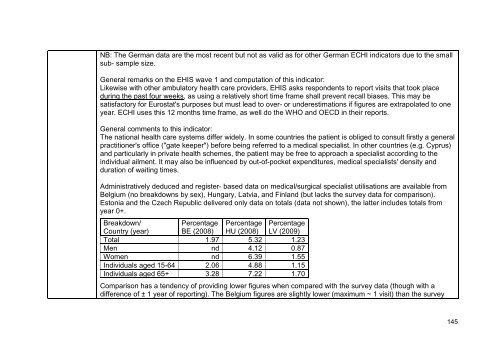
NB: The German data are the most recent but not as valid as for other German ECHI indicators due to the small<br />
sub- sample size.<br />
General remarks on the EHIS wave 1 <strong>and</strong> computation of this indicator:<br />
Likewise with other ambulatory health care providers, EHIS asks respondents to report visits that took place<br />
during the past four weeks, as using a relatively short time frame shall prevent recall biases. This may be<br />
satisfactory for Eurostat's purposes but must lead to over- or underestimations if figures are extrapolated to one<br />
year. ECHI uses this 12 months time frame, as well do the WHO <strong>and</strong> OECD in their reports.<br />
General comments to this indicator:<br />
The national health care systems differ widely. In some countries the patient is obliged to consult firstly a general<br />
practitioner's office ("gate keeper") before being referred to a medical specialist. In other countries (e.g. Cyprus)<br />
<strong>and</strong> particularly in private health schemes, the patient may be free to approach a specialist according to the<br />
individual ailment. It may also be influenced by out-of-pocket expenditures, medical specialists' density <strong>and</strong><br />
duration of waiting times.<br />
Administratively deduced <strong>and</strong> register- based data on medical/surgical specialist utilisations are available from<br />
Belgium (no breakdowns by sex), Hungary, Latvia, <strong>and</strong> Finl<strong>and</strong> (but lacks the survey data for comparison).<br />
Estonia <strong>and</strong> the Czech Republic delivered only data on totals (data not shown), the latter includes totals from<br />
year 0+.<br />
Breakdown/<br />
Country (year)<br />
Percentage<br />
BE (2008)<br />
Percentage<br />
HU (2008)<br />
Percentage<br />
LV (2009)<br />
Total 1.97 5.32 1.23<br />
Men nd 4.12 0.87<br />
Women nd 6.39 1.55<br />
Individuals aged 15-64 2.06 4.88 1.15<br />
Individuals aged 65+ 3.28 7.22 1.70<br />
Comparison has a tendency of providing lower figures when compared with the survey data (though with a<br />
difference of ± 1 year of reporting). The Belgium figures are slightly lower (maximum ~ 1 visit) than the survey<br />
145