

Research Journal of Commerce & Behavioural Science - RJCBS
Research Journal of Commerce & Behavioural Science - RJCBS
Research Journal of Commerce & Behavioural Science - RJCBS

Create successful ePaper yourself
Turn your PDF publications into a flip-book with our unique Google optimized e-Paper software.
The latter has range <strong>of</strong> 0-4. If one student reported no cheating behavior, he would score “0”, if he<br />
reported one cheating behavior, for example if he encircled “Yes” in any question in that group, he<br />
would be entitled to have score “1” and up to a maximum <strong>of</strong> “4”. In other words a summation is done.<br />
Paulhus’s (1991) impression management subscale constituted <strong>of</strong> 20 questions. Respondents who<br />
selected “1 or 2” or “6 or7”, it would be coded as “1=bias response” in SPSS and those who picked “4,<br />
3 or 5”, would be coded as “0=non-bias response”. For example the first statement in Paulhus (1991)<br />
Impression management subscale, the socially desirable manner is found on the “1” and “2” <strong>of</strong> the<br />
Likert scale, thus a student who picked “1” or “ 2”, would score “1”,if he did not pick ‘1’ or ‘2’, he<br />
would score “0”. Moreover, the SDM on the second statement is found on the “6” and “7”, if a student<br />
would picked either 6 or 7 he would score “1” and if not so he would score “0”. If a student get 0 out<br />
<strong>of</strong> 20 as a score he would be considered as one who did not respond in a social desirable manner and if<br />
he scored 20 out <strong>of</strong> 20, he would be responding in an awfully social desirable way. Hence higher the<br />
score, higher would be the degree <strong>of</strong> answering in a social desirable manner.<br />
3.2.2 RESPONSE VARIABLES<br />
The remaining two variables would be dependent variables. Therefore, question number 8 and 14 were<br />
to be considered as dependent variables. They were coded as “1” for those who answered “Yes” and<br />
“0” for those who have answered “No”.<br />
4.0 DATA ANALYSIS AND FINDINGS<br />
Respondent pr<strong>of</strong>ile<br />
The majority <strong>of</strong> participants were female, with a percentage <strong>of</strong> 60.3% (181) and 39.7% (119 for<br />
males). Among the 300 participants, 217 (72.8%) were from the Faculty Law and Management, 8<br />
(2.7%) students were from the Faculty <strong>of</strong> Agriculture. The Faculty <strong>of</strong> Engineering registered 33 (11%)<br />
participants while 10 (3.3%) students were from Faculty <strong>of</strong> <strong>Science</strong>. Finally, the Faculty <strong>of</strong> Social<br />
Studies and Humanities had 32 (10.7%) respondents.<br />
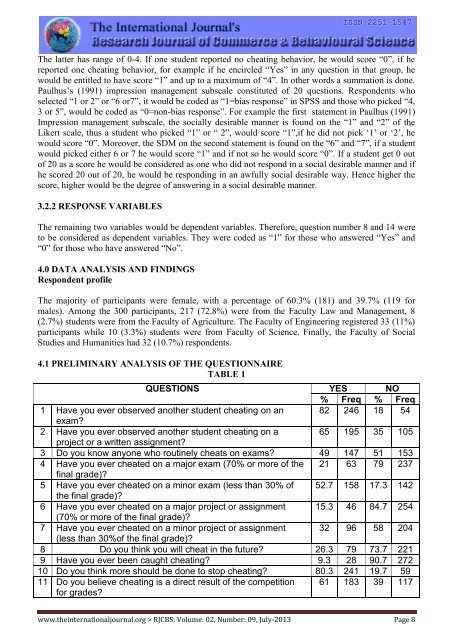
4.1 PRELIMINARY ANALYSIS OF THE QUESTIONNAIRE<br />
TABLE 1<br />
QUESTIONS YES NO<br />
% Freq % Freq<br />
1 Have you ever observed another student cheating on an 82 246 18 54<br />
exam?<br />
2 Have you ever observed another student cheating on a 65 195 35 105<br />
project or a written assignment?<br />
3 Do you know anyone who routinely cheats on exams? 49 147 51 153<br />
4 Have you ever cheated on a major exam (70% or more <strong>of</strong> the 21 63 79 237<br />
final grade)?<br />
5 Have you ever cheated on a minor exam (less than 30% <strong>of</strong> 52.7 158 17.3 142<br />
the final grade)?<br />
6 Have you ever cheated on a major project or assignment 15.3 46 84.7 254<br />
(70% or more <strong>of</strong> the final grade)?<br />
7 Have you ever cheated on a minor project or assignment 32 96 58 204<br />
(less than 30%<strong>of</strong> the final grade)?<br />
8 Do you think you will cheat in the future? 26.3 79 73.7 221<br />
9 Have you ever been caught cheating? 9.3 28 90.7 272<br />
10 Do you think more should be done to stop cheating? 80.3 241 19.7 59<br />
11 Do you believe cheating is a direct result <strong>of</strong> the competition<br />
for grades?<br />
61 183 39 117<br />
www.theinternationaljournal.org > <strong>RJCBS</strong>: Volume: 02, Number: 09, July-2013 Page 8


