The Earth Scientist
Fall 12.pdf - NESTA
Fall 12.pdf - NESTA
- No tags were found...

You also want an ePaper? Increase the reach of your titles
YUMPU automatically turns print PDFs into web optimized ePapers that Google loves.
Volume XXVIII, Issue 3<br />
Page 21<br />
the local study site over the course of a year. While<br />
it would be ideal for students to work with observations<br />
taken locally, these data are not always available.<br />
In these cases, students can use data from a school<br />
in Greenville, Pennsylvania USA that has several<br />
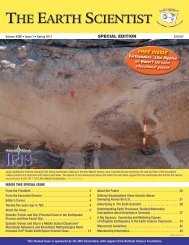
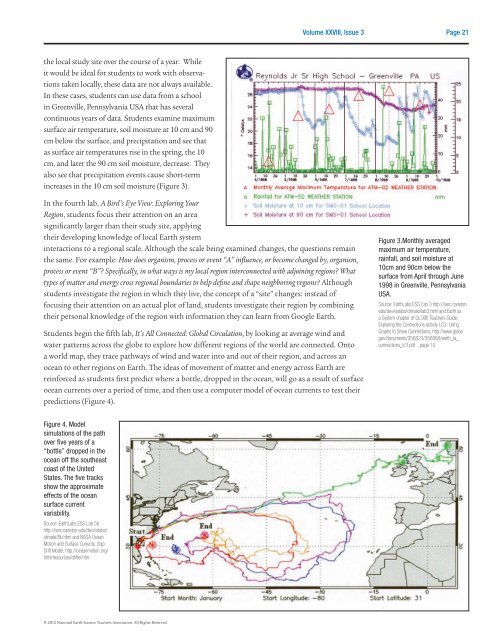
continuous years of data. Students examine maximum<br />
surface air temperature, soil moisture at 10 cm and 90<br />
cm below the surface, and precipitation and see that<br />
as surface air temperatures rise in the spring, the 10<br />
cm, and later the 90 cm soil moisture, decrease. <strong>The</strong>y<br />
also see that precipitation events cause short-term<br />
increases in the 10 cm soil moisture (Figure 3).<br />
In the fourth lab, A Bird’s Eye View: Exploring Your<br />
Region, students focus their attention on an area<br />
significantly larger than their study site, applying<br />
their developing knowledge of local <strong>Earth</strong> system<br />
interactions to a regional scale. Although the scale being examined changes, the questions remain<br />
the same. For example: How does organism, process or event “A” influence, or become changed by, organism,<br />
process or event “B”? Specifically, in what ways is my local region interconnected with adjoining regions? What<br />
types of matter and energy cross regional boundaries to help define and shape neighboring regions? Although<br />
students investigate the region in which they live, the concept of a “site” changes: instead of<br />
focusing their attention on an actual plot of land, students investigate their region by combining<br />
their personal knowledge of the region with information they can learn from Google <strong>Earth</strong>.<br />
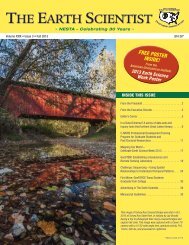
Students begin the fifth lab, It’s All Connected: Global Circulation, by looking at average wind and<br />
water patterns across the globe to explore how different regions of the world are connected. Onto<br />
a world map, they trace pathways of wind and water into and out of their region, and across an<br />
ocean to other regions on <strong>Earth</strong>. <strong>The</strong> ideas of movement of matter and energy across <strong>Earth</strong> are<br />
reinforced as students first predict where a bottle, dropped in the ocean, will go as a result of surface<br />
ocean currents over a period of time, and then use a computer model of ocean currents to test their<br />
predictions (Figure 4).<br />
Figure 3.Monthly averaged<br />
maximum air temperature,<br />
rainfall, and soil moisture at<br />
10cm and 90cm below the<br />
surface from April through June<br />
1998 in Greenville, Pennsylvania<br />
USA.<br />
Source: <strong>Earth</strong>Labs ESS Lab 3 http://serc.carleton.<br />
edu/dev/eslabs/climate/lab3.html and <strong>Earth</strong> as<br />
a System chapter of GLOBE Teachers Guide:<br />
Exploring the Connections activity LC3: Using<br />
Graphs to Show Connections, http://www.globe.<br />
gov/documents/356823/356868/earth_la_<br />
connections_lc3.pdf , page 10.<br />
Figure 4. Model<br />
simulations of the path<br />
over five years of a<br />
“bottle” dropped in the<br />
ocean off the southeast<br />
coast of the United<br />
States. <strong>The</strong> five tracks<br />
show the approximate<br />
effects of the ocean<br />
surface current<br />
variability.<br />
Source: <strong>Earth</strong>Labs ESS Lab 5b<br />
http://serc.carleton.edu/dev/eslabs/<br />
climate/5b.html and NASA Ocean<br />
Motion and Surface Currents, Ship<br />
Drift Model, http://oceanmotion.org/<br />
html/resources/drifter.htm.<br />
© 2012 National <strong>Earth</strong> Science Teachers Association. All Rights Reserved.