

ARCHITECTURE
The_Art_of_Inequality
The_Art_of_Inequality

You also want an ePaper? Increase the reach of your titles
YUMPU automatically turns print PDFs into web optimized ePapers that Google loves.
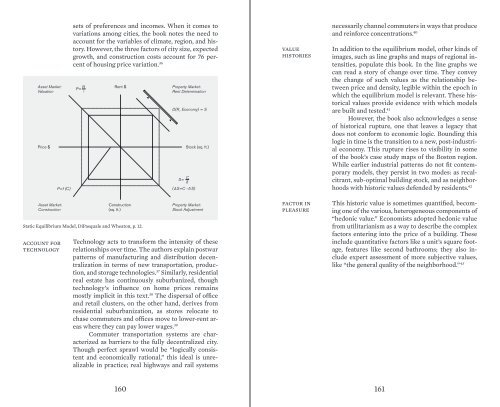
Asset Market:<br />
Valuation<br />
Price $<br />
Asset Market:<br />
Construction<br />
account for<br />
technology<br />
P=f (C)<br />
sets of preferences and incomes. When it comes to<br />
variations among cities, the book notes the need to<br />
account for the variables of climate, region, and history.<br />
However, the three factors of city size, expected<br />
growth, and construction costs account for 76 percent<br />
of housing price variation. 36<br />
P= R i<br />
Rent $<br />
Construction<br />
(sq. ft.)<br />
Static Equilibrium Model, DiPasquale and Wheaton, p. 12.<br />
Property Market:<br />
Rent Determination<br />
D(R 1<br />
Economy) = S<br />
S= C<br />
( S=C - S)<br />
Stock (sq. ft.)<br />
Property Market:<br />
Stock Adjustment<br />
Technology acts to transform the intensity of these<br />
relationships over time. The authors explain postwar<br />
patterns of manufacturing and distribution decentralization<br />
in terms of new transportation, production,<br />
and storage technologies. 37 Similarly, residential<br />
real estate has continuously suburbanized, though<br />
technology’s influence on home prices remains<br />
mostly implicit in this text. 38 The dispersal of office<br />
and retail clusters, on the other hand, derives from<br />
residential suburbanization, as stores relocate to<br />
chase commuters and offices move to lower-rent areas<br />
where they can pay lower wages. 39<br />
Commuter transportation systems are characterized<br />
as barriers to the fully decentralized city.<br />
Though perfect sprawl would be “logically consistent<br />
and economically rational,” this ideal is unrealizable<br />
in practice; real highways and rail systems<br />
value<br />
histories<br />
factor in<br />
pleasure<br />
necessarily channel commuters in ways that produce<br />
and reinforce concentrations. 40<br />
In addition to the equilibrium model, other kinds of<br />
images, such as line graphs and maps of regional intensities,<br />
populate this book. In the line graphs we<br />
can read a story of change over time. They convey<br />
the change of such values as the relationship between<br />
price and density, legible within the epoch in<br />
which the equilibrium model is relevant. These historical<br />
values provide evidence with which models<br />
are built and tested. 41<br />
However, the book also acknowledges a sense<br />
of historical rupture, one that leaves a legacy that<br />
does not conform to economic logic. Bounding this<br />
logic in time is the transition to a new, post-industrial<br />
economy. This rupture rises to visibility in some<br />
of the book’s case study maps of the Boston region.<br />
While earlier industrial patterns do not fit contemporary<br />
models, they persist in two modes: as recalcitrant,<br />
sub-optimal building stock, and as neighborhoods<br />
with historic values defended by residents. 42<br />
This historic value is sometimes quantified, becoming<br />
one of the various, heterogeneous components of<br />
“hedonic value.” Economists adopted hedonic value<br />
from utilitarianism as a way to describe the complex<br />
factors entering into the price of a building. These<br />
include quantitative factors like a unit’s square footage,<br />
features like second bathrooms; they also include<br />
expert assessment of more subjective values,<br />
like “the general quality of the neighborhood.” 43<br />
160 161