XDSAPP - Helmholtz-Zentrum Berlin
XDSAPP - Helmholtz-Zentrum Berlin
XDSAPP - Helmholtz-Zentrum Berlin

You also want an ePaper? Increase the reach of your titles
YUMPU automatically turns print PDFs into web optimized ePapers that Google loves.
data set to be processed has to be selected and IPMOSFLM (Leslie,<br />
1999) is used to read the image headers in order to create an<br />
appropriate XDS.INP file. Then, XDS is launched to run the tasks<br />
INIT, COLSPOT and IDXREF, and a summary of the indexing<br />
process is displayed. Next, <strong>XDSAPP</strong> calls XDS with the tasks<br />
DEFPIX, INTEGRATE and CORRECT, all with space group option<br />
‘0’ for processing of the data in space group P1. After postrefinement<br />
of the orientation and the cell parameters within the CORRECT<br />
step, one reintegration step using the refined parameters (from<br />
GXPARM.XDS) and the suggested values for BEAM DIVERGENCE,<br />
REFLECTING RANGE and their s.u. values (from INTEGRATE.LP)<br />
is performed by default. Preliminary results are displayed after each<br />
integration step. Further reintegration steps can be performed until<br />
no further improvements of resolution and/or quality in the previous<br />
integration step are detected. After the (re)integration has finished,<br />
the program POINTLESS (Evans, 2006) is used to determine the<br />
most probable space group of the data set and the CORRECT step is<br />
rerun in that space group. If the space group and unit-cell parameters<br />
of the data set are known beforehand, this step can be omitted by<br />
providing <strong>XDSAPP</strong> with these values via the ‘Settings’ tab. A resolution<br />
cut-off is applied, and intensity checks for twinning and/or<br />
pseudo-translation are done by using SFCHECK (Vaguine et al.,<br />
1999) and PHENIX.XTRIAGE (Adams et al., 2010). Several plots of<br />
the quality indicators provided by the CORRECT step are generated,<br />
as well as plots of Rmeas or Rr.i.m. per frame, and the decay R factor RD<br />
provided by XDSSTAT (Diederichs, 2006). All plots are also stored<br />
as a pdf file in the data processing directory. A summary of the<br />
processing results is presented for a quick results overview. Using the<br />
program XDSCONV, intensity files suitable for CCP4 (Collaborative<br />
Computational Project, Number 4, 1994), CNS (Brunger, 2007) and<br />
SHELX (Sheldrick, 2008) are produced.<br />
2.2. Hardware provisions<br />
XDS is the only data processing program known to us that is able<br />
to utilize multiprocessor architectures during the course of the data<br />
processing. In particular, the most time-consuming steps, such as the<br />
search for strong spots for auto-indexing or the integration of the<br />
images, are highly parallelized. Within the infrastructure at HZB, we<br />
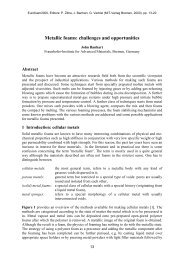
Figure 1<br />
Start-up window of <strong>XDSAPP</strong>. The eight tabs are (from left to right) ‘Input’,<br />
‘SingleDataset’, ‘MultipleDatasets’, ‘Statistics’, ‘Plotting Utilities’, ‘Logfiles and<br />
pictures’, ‘Settings’ and ‘Running output’.<br />
are using an HP-DL580 G7 40-CPU-core server, which is attached to<br />
a large storage area network array via several fibre channel uplinks.<br />
2.3. Software environment<br />
<strong>XDSAPP</strong> runs under Linux and needs the installation of Tcl/Tk<br />
version 8.4 or newer. In addition to the above-mentioned crystallographic<br />
software, an installation of gnuplot (at least version 4.0) and<br />
ImageMagick (6.2.5 or newer) is needed. In order to have the full<br />
functionality of <strong>XDSAPP</strong>, the XDS viewer and the old XDS viewing<br />
program VIEW also have to be installed.<br />
2.4. Usage<br />
computer programs<br />
The main window of <strong>XDSAPP</strong> is separated into eight different<br />
tabs representing the different possible tasks (Fig. 1). After having<br />
started <strong>XDSAPP</strong>, the user first has to select the detector used for<br />
data collection within the ‘Input’ tab. Here, one can also select the<br />
directory in which <strong>XDSAPP</strong> is looking for diffraction images (the<br />
default is the directory from which <strong>XDSAPP</strong> has been started). By<br />
pushing the appropriate button within the ‘SingleDataset’ tab, a<br />
dialog window (Fig. 1 inset) allowing the selection of a data set opens.<br />
The selected data set can then be indexed or processed by clicking the<br />
appropriate buttons within the ‘SingleDataset’ tab. Results of the<br />
indexing step are displayed within the tab. During integration,<br />
preliminary results are given within the ‘SingleDataset’ tab. The most<br />
important statistics of the integration step are presented as plots<br />
synchronously for each integration cycle within the ‘Statistics’ tab<br />
(Fig. 2). After finishing, a summary of the processing results of the<br />
data set is given within the ‘SingleDataset’ tab (Fig. 3), and plots of<br />
statistics generated by the CORRECT step and XDSSTAT can be<br />
viewed as plots in the ‘Statistics’ tab (Fig. 4).<br />
In the ‘MultipleDatasets’ tab the user can provide <strong>XDSAPP</strong> with a<br />
directory containing multiple data sets. All the data sets within this<br />
directory and its subdirectories will then be processed subsequently.<br />
In the ‘Logfiles and pictures’ tab all the log files of the different<br />
processing steps and the images generated by XDS and XDSSTAT<br />
can be viewed. In the ‘Plotting Utilities’ tab plots of the statistics of a<br />
processed data set can be generated. This can also be applied to a<br />
Figure 2<br />
The ‘Statistics’ tab displays plots of the most relevant statistics of the different XDS<br />
processing steps (COLSPOT, INTEGRATE, CORRECT) and XDSSTAT. The<br />
statistics of the INTEGRATE step can be followed concurrently during the<br />
integration. This example (case study 1) shows the statistics after 120 out of the 180<br />
frames of the data set have been integrated.<br />
J. Appl. Cryst. (2012). 45, 568–572 Michael Krug et al. <strong>XDSAPP</strong> 569<br />
electronic reprint