XDSAPP - Helmholtz-Zentrum Berlin
XDSAPP - Helmholtz-Zentrum Berlin
XDSAPP - Helmholtz-Zentrum Berlin

You also want an ePaper? Increase the reach of your titles
YUMPU automatically turns print PDFs into web optimized ePapers that Google loves.
computer programs<br />
data set that has been processed by XDS in the conventional manual<br />
way. In the ‘Settings’ tab the settings of, for example, parameters for<br />
XDS like the spot range, direct beam position or resolution range can<br />
be changed. If the space group and unit-cell parameters of a data set<br />
are known beforehand they can also be given here and <strong>XDSAPP</strong> will<br />
process the data set in the given space group.<br />
The ‘Settings’ tab also provides the possibility to define the resolution<br />
limit of a data set by setting threshold values for completeness,<br />
I/ (I) and Rmeas (or Rr.i.m.). <strong>XDSAPP</strong> will then run XDS to the<br />
maximum resolution possible during the first integration run and use<br />
the threshold values to define the resolution cut-off of the data set for<br />
the subsequent integration run.<br />
3. Results and discussion<br />
In order to demonstrate the versatility of <strong>XDSAPP</strong>, two data sets<br />
collected at BL14.1 at BESSY II were processed with <strong>XDSAPP</strong> using<br />
the default settings.<br />
3.1. Case study 1<br />
The first case study is a data set of a cubic insulin crystal collected<br />
at a wavelength of 1.77 A˚ (Faust et al., 2008). The image range(s) for<br />
collecting strong spots during the COLSPOT step are set dynamically<br />
by <strong>XDSAPP</strong> depending on the overall number of images a data set<br />
consists of. In this case, frames 1–12 and 84–96 were used to collect<br />
strong spots from. As this data set is of rather high quality, the<br />
resulting indexing was very accurate, as shown by a standard deviation<br />
of spot position of 0.34 pixels before and 0.29 pixels after<br />
refinement. The mean absolute difference between observed and<br />
fitted indices was also quite low (DH = 0.03, DK = 0.02, DL = 0.03).<br />
Consequently, the first integration step already produced good results<br />
so that the second, automatically launched, integration step only led<br />
to a minor improvement of data quality. Since it is not possible to<br />
distinguish between space group I23 and I213 from diffraction data<br />
alone, <strong>XDSAPP</strong> processed the data set in space group I23. A<br />
comparison with the manual XDS processing of the data set is given<br />
in Table 1. For the manual processing of this data set the value range<br />
for trusted pixels on the detector was adjusted, because otherwise<br />
XDS did not exclude all of the intruding hardware shadows from the<br />
trusted region of the detector. This was done by inspecting the file<br />
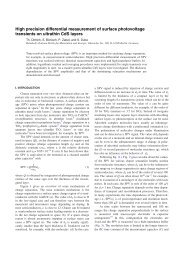
Figure 3<br />
Case study 1. A summary of the processing results of the data set is given within the<br />
‘SingleDataset’ tab.<br />
BKGPIX.cbf, adjusting the values for the trusted pixel range and<br />
repeating the DEFPIX step until all of the intruding hardware<br />
shadows were visually removed from the trusted region. Presently,<br />
<strong>XDSAPP</strong> is not able to perform such an adjustment automatically. As<br />
a consequence, the number of total reflections is smaller for the<br />
manually processed data set. Also, the R values as well as the<br />
completeness for the highest-resolution shell are lower in the case of<br />
the manual processing. Nevertheless, the quality of the two processing<br />
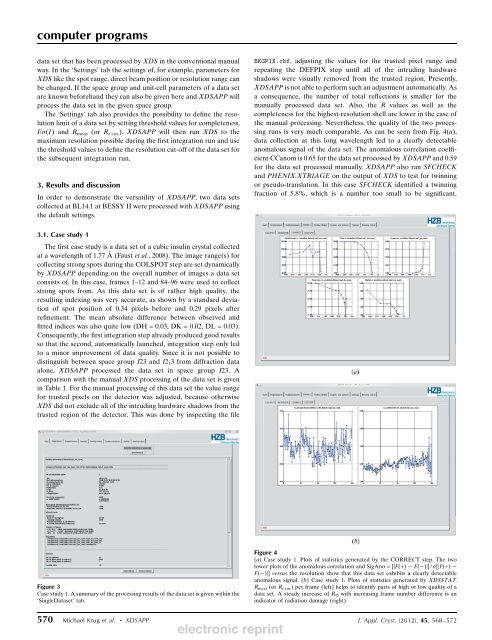
runs is very much comparable. As can be seen from Fig. 4(a),<br />
data collection at this long wavelength led to a clearly detectable<br />
anomalous signal of the data set. The anomalous correlation coefficient<br />
CCanom is 0.65 for the data set processed by <strong>XDSAPP</strong> and 0.59<br />
for the data set processed manually. <strong>XDSAPP</strong> also ran SFCHECK<br />
and PHENIX.XTRIAGE on the output of XDS to test for twinning<br />
or pseudo-translation. In this case SFCHECK identified a twinning<br />
fraction of 5.8%, which is a number too small to be significant.<br />
Figure 4<br />
(a) Case study 1. Plots of statistics generated by the CORRECT step. The two<br />
lower plots of the anomalous correlation and SigAno = [|F(+) F( )|] / [|F(+)<br />
F( )|] versus the resolution show that this data set exhibits a clearly detectable<br />
anomalous signal. (b) Case study 1. Plots of statistics generated by XDSSTAT.<br />
Rmeas (or Rr.i.m.) per frame (left) helps to identify parts of high or low quality of a<br />
data set. A steady increase of RD with increasing frame number difference is an<br />
indicator of radiation damage (right).<br />
570 Michael Krug et al. <strong>XDSAPP</strong> J. Appl. Cryst. (2012). 45, 568–572<br />
electronic reprint