


You also want an ePaper? Increase the reach of your titles
YUMPU automatically turns print PDFs into web optimized ePapers that Google loves.
SUBSTANCE USE AND SUBSTANCE USE<br />
DISORDERS<br />
Psychoactive substance use (including alcohol and illicit drugs) is an important risk fac<strong>to</strong>r for poor health<br />
globally. 11,73 The use of dependence producing substances may result in development of substance use<br />
disorders. The in<strong>to</strong>xicating effects of psychoactive substances, or their <strong>to</strong>xic effects on organs and tissues,<br />
or the mode of their administration, are also contributing fac<strong>to</strong>rs <strong>to</strong> the development of diseases, injuries<br />
and other health conditions. 12<br />
TRENDS<br />
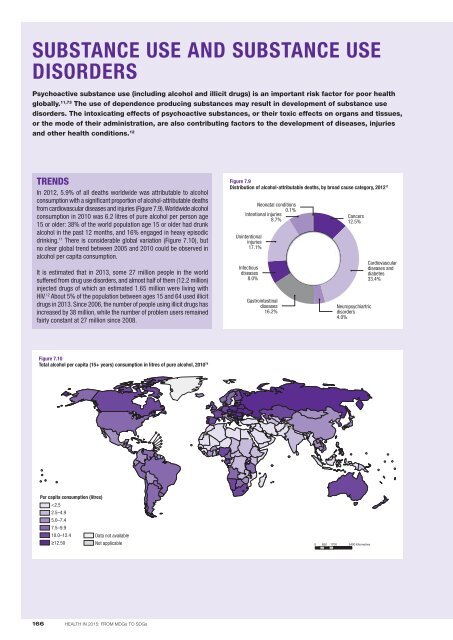
In 2012, 5.9% of all deaths worldwide was attributable <strong>to</strong> alcohol<br />
consumption with a significant proportion of alcohol-attributable deaths<br />
<strong>from</strong> cardiovascular diseases and injuries (Figure 7.9). Worldwide alcohol<br />
consumption in 2010 was 6.2 litres of pure alcohol per person age<br />
15 or older: 38% of the world population age 15 or older had drunk<br />
alcohol in the past 12 months, and 16% engaged in heavy episodic<br />
drinking. 11 There is considerable global variation (Figure 7.10), but<br />
no clear global trend between 2005 and 2010 could be observed in<br />
alcohol per capita consumption.<br />
It is estimated that in 2013, some 27 million people in the world<br />
suffered <strong>from</strong> drug use disorders, and almost half of them (12.2 million)<br />
injected drugs of which an estimated 1.65 million were living with<br />
HIV. 12 About 5% of the population between ages 15 and 64 used illicit<br />
drugs in 2013. Since 2006, the number of people using illicit drugs has<br />
increased by 38 million, while the number of problem users remained<br />
fairly constant at 27 million since 2008.<br />
Figure 7.9<br />
Distribution of alcohol-attributable deaths, by broad cause category, 2012 11<br />
Neonatal conditions<br />
0.1%<br />
Intentional injuries<br />
8.7%<br />
Unintentional<br />
injuries<br />
17.1%<br />
Infectious<br />
diseases<br />
8.0%<br />
Gastrointestinal<br />
diseases<br />
16.2%<br />
Cancers<br />
12.5%<br />
Neuropsychiartric<br />
disorders<br />
4.0%<br />
Cardiovascular<br />
diseases and<br />
diabetes<br />
33.4%<br />
Figure 7.10<br />
Total alcohol per capita (15+ years) consumption in litres of pure alcohol, 2010 74 0 1700 3400<br />
Per capita consumption (litres)<br />
Per capita consumption (litres)<br />