


You also want an ePaper? Increase the reach of your titles
YUMPU automatically turns print PDFs into web optimized ePapers that Google loves.
perpetrated by someone known <strong>to</strong> the victim. For example,<br />
based on data <strong>from</strong> 79 countries and two terri<strong>to</strong>ries, one<br />
in three women worldwide have experienced physical<br />
and or sexual violence by an intimate partner or sexual<br />
violence by perpetra<strong>to</strong>rs other than partners. 8 This form of<br />
violence appears <strong>to</strong> be common in all regions. With regard<br />
<strong>to</strong> children, physical violence and abuse is experienced by<br />
both boys and girls. One quarter of all adults report having<br />
been physically abused as children, and around 20% of<br />
women and 5–10% of men report having been sexually<br />
abused as a child. 5 Older people are also victims of violence,<br />
as indicated by some studies reporting that 6% of older<br />
adults report abuse in the past month. However, data are<br />
limited on the prevalence of elder abuse, particularly <strong>from</strong><br />
low- and middle-income countries. 9<br />
Natural disasters were not mentioned in the MDGs, but<br />
are referred <strong>to</strong> several times in the SDGs (Targets 1.5, 3.d,<br />
11.5 and 13.1). As part of the goal on cities and human<br />
settlements, Target 11.5 states: “By 2030, significantly<br />
reduce the number of deaths and the number of people<br />
affected and substantially decrease the direct economic<br />
losses relative <strong>to</strong> global gross domestic product caused by<br />
disasters, including water-related disasters, with a focus<br />
on protecting the poor and people in vulnerable situations.”<br />
Target 13.1 refers <strong>to</strong> climate-related disasters: “Strengthen<br />
resilience and adaptive capacity <strong>to</strong> climate-related hazards<br />
and natural disasters in all countries”.<br />
Annually, there were an average 656 reported disasters and<br />
86 500 deaths during 2000–2014, excluding epidemics. 10<br />
Overall, the largest numbers of deaths are associated with<br />
earthquakes and tsunamis, but s<strong>to</strong>rms also take a heavy <strong>to</strong>ll.<br />
The economic losses of disasters vary considerably and, in<br />
absolute terms, are usually much higher in high-income<br />
countries. However, expressed as a percentage of GDP, the<br />
direct economic losses <strong>from</strong> natural disasters in low-income<br />
countries between 1980 and 2011 were found <strong>to</strong> be more<br />
than 14 times higher than in high-income countries.<br />
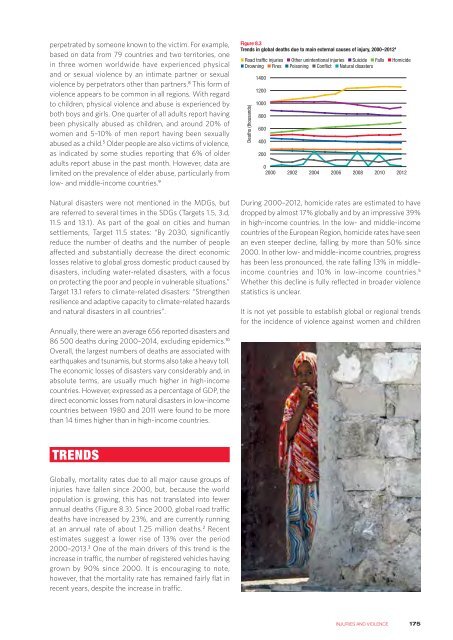
Figure 8.3<br />
Trends in global deaths due <strong>to</strong> main external causes of injury, 2000–2012 4<br />
Road traffic injuries Other unintentional injuries Suicide Falls Homicide<br />
Drowning Fires Poisoning Conflict Natural disasters<br />
Deaths (thousands)<br />
1400<br />
1200<br />
1000<br />
800<br />
600<br />
400<br />
200<br />
0<br />
2000 2002 2004 2006 2008 2010 2012<br />
During 2000–2012, homicide rates are estimated <strong>to</strong> have<br />
dropped by almost 17% globally and by an impressive 39%<br />
in high-income countries. In the low- and middle-income<br />
countries of the European Region, homicide rates have seen<br />
an even steeper decline, falling by more than 50% since<br />
2000. In other low- and middle-income countries, progress<br />
has been less pronounced, the rate falling 13% in middleincome<br />
countries and 10% in low-income countries. 5<br />
Whether this decline is fully reflected in broader violence<br />
statistics is unclear.<br />
It is not yet possible <strong>to</strong> establish global or regional trends<br />
for the incidence of violence against women and children<br />
TRENDS<br />
Globally, mortality rates due <strong>to</strong> all major cause groups of<br />
injuries have fallen since 2000, but, because the world<br />
population is growing, this has not translated in<strong>to</strong> fewer<br />
annual deaths (Figure 8.3). Since 2000, global road traffic<br />
deaths have increased by 23%, and are currently running<br />
at an annual rate of about 1.25 million deaths. 2 Recent<br />
estimates suggest a lower rise of 13% over the period<br />
2000–2013. 3 One of the main drivers of this trend is the<br />
increase in traffic, the number of registered vehicles having<br />
grown by 90% since 2000. It is encouraging <strong>to</strong> note,<br />
however, that the mortality rate has remained fairly flat in<br />
recent years, despite the increase in traffic.<br />
INJURIES AND VIOLENCE<br />
175