Public Attitudes to Peace Walls (2015)
1RRkqqy
1RRkqqy

You also want an ePaper? Increase the reach of your titles
YUMPU automatically turns print PDFs into web optimized ePapers that Google loves.
<strong>Public</strong> <strong>Attitudes</strong> <strong>to</strong> <strong>Peace</strong> <strong>Walls</strong> (<strong>2015</strong>)<br />
Survey Results<br />
Ulster University<br />
3.7 Comparison with the 2012 survey<br />
Since the last survey was conducted in 2012, it is important <strong>to</strong> note that changes in attitudes since<br />
then will necessarily reflect political and demographic changes that have taken place over the last<br />
three years. It should also be noted that the 2012 survey did not include the Lurgan/Portadown area.<br />
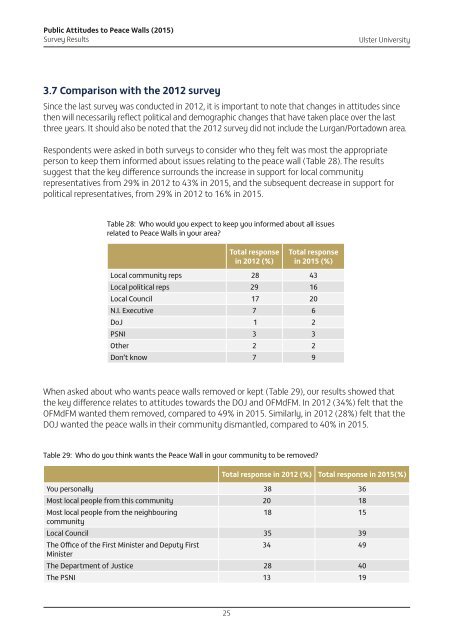
Respondents were asked in both surveys <strong>to</strong> consider who they felt was most the appropriate<br />
person <strong>to</strong> keep them informed about issues relating <strong>to</strong> the peace wall (Table 28). The results<br />
suggest that the key difference surrounds the increase in support for local community<br />
representatives from 29% in 2012 <strong>to</strong> 43% in <strong>2015</strong>, and the subsequent decrease in support for<br />
political representatives, from 29% in 2012 <strong>to</strong> 16% in <strong>2015</strong>.<br />
Table 28: Who would you expect <strong>to</strong> keep you informed about all issues<br />
related <strong>to</strong> <strong>Peace</strong> <strong>Walls</strong> in your area?<br />
Total response<br />
in 2012 (%)<br />
Total response<br />
in <strong>2015</strong> (%)<br />
Local community reps 28 43<br />
Local political reps 29 16<br />
Local Council 17 20<br />
N.I. Executive 7 6<br />
DoJ 1 2<br />
PSNI 3 3<br />
Other 2 2<br />
Don’t know 7 9<br />
When asked about who wants peace walls removed or kept (Table 29), our results showed that<br />
the key difference relates <strong>to</strong> attitudes <strong>to</strong>wards the DOJ and OFMdFM. In 2012 (34%) felt that the<br />
OFMdFM wanted them removed, compared <strong>to</strong> 49% in <strong>2015</strong>. Similarly, in 2012 (28%) felt that the<br />
DOJ wanted the peace walls in their community dismantled, compared <strong>to</strong> 40% in <strong>2015</strong>.<br />
Table 29: Who do you think wants the <strong>Peace</strong> Wall in your community <strong>to</strong> be removed?<br />
Total response in 2012 (%) Total response in <strong>2015</strong>(%)<br />
You personally 38 36<br />
Most local people from this community 20 18<br />
Most local people from the neighbouring<br />
community<br />
18 15<br />
Local Council 35 39<br />
The Office of the First Minister and Deputy First<br />
Minister<br />
34 49<br />
The Department of Justice 28 40<br />
The PSNI 13 19<br />
25