Public Attitudes to Peace Walls (2015)
1RRkqqy
1RRkqqy

Create successful ePaper yourself
Turn your PDF publications into a flip-book with our unique Google optimized e-Paper software.
<strong>Public</strong> <strong>Attitudes</strong> <strong>to</strong> <strong>Peace</strong> <strong>Walls</strong> (<strong>2015</strong>)<br />
Survey Results<br />
Ulster University<br />
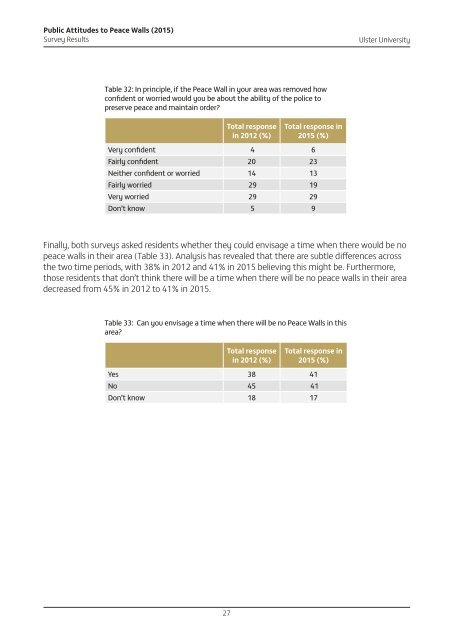
Table 32: In principle, if the <strong>Peace</strong> Wall in your area was removed how<br />
confident or worried would you be about the ability of the police <strong>to</strong><br />
preserve peace and maintain order?<br />
Total response<br />
in 2012 (%)<br />
Total response in<br />
<strong>2015</strong> (%)<br />
Very confident 4 6<br />
Fairly confident 20 23<br />
Neither confident or worried 14 13<br />
Fairly worried 29 19<br />
Very worried 29 29<br />
Don’t know 5 9<br />
Finally, both surveys asked residents whether they could envisage a time when there would be no<br />
peace walls in their area (Table 33). Analysis has revealed that there are subtle differences across<br />
the two time periods, with 38% in 2012 and 41% in <strong>2015</strong> believing this might be. Furthermore,<br />
those residents that don’t think there will be a time when there will be no peace walls in their area<br />
decreased from 45% in 2012 <strong>to</strong> 41% in <strong>2015</strong>.<br />
Table 33: Can you envisage a time when there will be no <strong>Peace</strong> <strong>Walls</strong> in this<br />
area?<br />
Total response<br />
in 2012 (%)<br />
Total response in<br />
<strong>2015</strong> (%)<br />
Yes 38 41<br />
No 45 41<br />
Don’t know 18 17<br />
27