

JANUARY
1857_mossialos_intl_profiles_2015_v6
1857_mossialos_intl_profiles_2015_v6

Create successful ePaper yourself
Turn your PDF publications into a flip-book with our unique Google optimized e-Paper software.
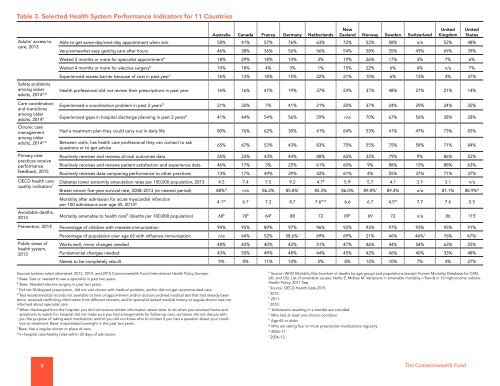
Table 3. Selected Health System Performance Indicators for 11 Countries<br />
Adults’ access to<br />
care, 2013<br />
New<br />
United United<br />
Australia Canada France Germany Netherlands Zealand Norway Sweden Switzerland Kingdom States<br />
Able to get same-day/next-day appointment when sick 58% 41% 57% 76% 63% 72% 52% 58% n/a 52% 48%<br />
Very/somewhat easy getting care after hours 46% 38% 36% 56% 56% 54% 58% 35% 49% 69% 39%<br />
Waited 2 months or more for specialist appointment a 18% 29% 18% 10% 3% 19% 26% 17% 3% 7% 6%<br />
Waited 4 months or more for elective surgery b 10% 18% 4% 3% 1% 15% 22% 6% 4% n/a 7%<br />
Experienced access barrier because of cost in past year c 16% 13% 18% 15% 22% 21% 10% 6% 13% 4% 37%<br />
Safety problems<br />
among sicker<br />
adults, 2014 o,p Health professional did not review their prescriptions in past year 16% 16% 47% 19% 37% 23% 37% 48% 27% 21% 14%<br />
Care coordination<br />
Experienced a coordination problem in past 2 years d 21% 32% 7% 41% 21% 20% 37% 24% 29% 24% 35%<br />
and transitions<br />
among older<br />
adults, 2014 o Experienced gaps in hospital discharge planning in past 2 years e 41% 44% 54% 56% 59% n/a 70% 67% 56% 38% 28%<br />
Chronic care<br />
management Had a treatment plan they could carry out in daily life 80% 76% 62% 30% 41% 64% 53% 41% 47% 73% 83%<br />
adults, 2014 n,o Between visits, has health care professional they can contact to ask<br />
questions or to get advice<br />
65% 67% 53% 43% 83% 75% 55% 75% 58% 71% 84%<br />
among older<br />
Primary care Routinely receives and reviews clinical outcomes data 35% 23% 43% 44% 88% 65% 32% 79% 9% 86% 52%<br />
practices receive<br />
performance Routinely receives and reviews patient satisfaction and experience data 46% 17% 3% 25% 61% 60% 9% 88% 15% 88% 63%<br />
feedback, 2015<br />
Routinely receives data comparing performance to other practices 13% 17% 49% 29% 42% 61% 4% 55% 37% 71% 37%<br />
OECD health care Diabetes lower extremity amputation rates per 100,000 population, 2013 4.5 7.4 7.5 9.2 4.7 k 5.9 j 5.7 4.1 3.1 j 3.1 n/a<br />
quality indicators i Breast cancer five-year survival rate, 2008–2013 (or nearest period) 88% q n/a 86.2% 85.8% r 85.3% 86.0% 89.8% r 89.4% n/a 81.1% 88.9% q<br />
Mortality after admission for acute myocardial infarction<br />
per 100 admissions over age 45, 2013 g 4.1 m 6.7 7.2 8.7 7.6 m,k 6.6 6.7 4.5 m 7.7 7.6 5.5<br />
Avoidable deaths,<br />
2013 Mortality amenable to health care h (deaths per 100,000 population) 68 k 78 k 64 k 88 72 89 k 69 72 n/a 86 115 l<br />
Prevention, 2013 i Percentage of children with measles immunization 94% 95% 89% 97% 96% 92% 93% 97% 93% 95% 91%<br />
Public views of<br />
health system,<br />
2013<br />
Percentage of population over age 65 with influenza immunization n/a 64% 52% 58.6% j 69% 69% 21% 46% 46% l 76% 67% j<br />
Works well, minor changes needed 48% 42% 40% 42% 51% 47% 46% 44% 54% 63% 25%<br />
Fundamental changes needed 43% 50% 49% 48% 44% 45% 42% 46% 40% 33% 48%<br />
Needs to be completely rebuilt 9% 8% 11% 10% 5% 8% 12% 10% 7% 4% 27%<br />
Sources (unless noted otherwise): 2013, 2014, and 2015 Commonwealth Fund International Health Policy Surveys.<br />
a Base: Saw or needed to see a specialist in past two years.<br />
b Base: Needed elective surgery in past two years.<br />
c<br />
Did not fill/skipped prescription, did not visit doctor with medical problem, and/or did not get recommended care.<br />
d<br />
Test results/medical records not available at time of appointment and/or doctors ordered medical test that had already been<br />
done; received conflicting information from different doctors; and/or specialist lacked medical history or regular doctor was not<br />
informed about specialist care.<br />
e When discharged from the hospital: you did not receive written information about what to do when you returned home and<br />
symptoms to watch for; hospital did not make sure you had arrangements for follow-up care; someone did not discuss with<br />
you the purpose of taking each medication; and/or you did not know who to contact if you had a question about your condition<br />
or treatment. Base: hospitalized overnight in the past two years.<br />
f Base: Has a regular doctor or place of care.<br />
g In-hospital case-fatality rates within 30 days of admission.<br />
h Source: WHO Mortality files (number of deaths by age group) and populations (except Human Mortality Database for CAN,<br />
UK, and US). List of amenable causes: Nolte E, McKee M. Variations in amenable mortality—Trends in 16 high-income nations.<br />
Health Policy. 2011 Sep.<br />
i Source: OECD Health Data 2015.<br />
j 2012.<br />
k 2011.<br />
l 2010.<br />
m Admissions resulting in a transfer are included.<br />
n Who had at least one chronic condition.<br />
o Age 65 or older.<br />
p Who are taking four or more prescription medications regularly.<br />
q 2006–11.<br />
r 2006–12.<br />
8<br />
The Commonwealth Fund