

THE NEW ZEALAND LIBRARY & INFORMATION MANAGEMENT JOURNAL NGĀ PŪRONGO
NZLIMJ%20Vol%2055%20Issue%203
NZLIMJ%20Vol%2055%20Issue%203

You also want an ePaper? Increase the reach of your titles
YUMPU automatically turns print PDFs into web optimized ePapers that Google loves.
<strong>NEW</strong> <strong>ZEALAND</strong> <strong>LIBRARY</strong> & <strong>INFORMATION</strong> <strong>MANAGEMENT</strong> <strong>JOURNAL</strong> • <strong>NGĀ</strong> <strong>PŪRONGO</strong> VOL 55, ISSUE NO. 3 • OCTOBER 2015<br />
on answers to the following three questions: ‘Have you ever<br />
needed information and support to help you deal with a difficult<br />
time in your life?’, ‘How old are you?’ and ‘What is your ethnic<br />
background’. It includes a sample size for each category of<br />
age and ethnicity variables, proportions of participants which<br />
belong to each category and the 95% approximate confidence<br />
interval for the proportions.<br />
spouse or partner (59%). The last column in Table 2 suggests<br />
that Professionals (doctors, counselors and pastors) were<br />
the first people New Zealand men approached asking for<br />
information and help when they needed it. Professionals were<br />
followed by Spouses/Partners, Male and Female friends in this<br />
particular order. The top five list completes Mother who ended<br />
on the fifth position.<br />
Table 2 could be used to answer the first part of the first<br />
question ‘Who were the most common kind of people New<br />
Zealand men went to for information?’ raised in the introduction<br />
section.<br />
Table 1: The socio-demographic distribution of those who<br />
seek and those who didn’t seek help<br />
There are no significant differences between two distributions<br />
by age in Table 1, x 2 (5, n = 1528) = 5.23, p = .39. The age<br />
structures of those who seek help and information and those<br />
who didn’t were quite similar in these two groups of participants.<br />
There are also no significant differences between two<br />
distributions by ethnicity in Table 1, x 2 (2, n = 1528) = .94, p<br />
= .62. The ethnic structures of those who seek help and<br />
information and those who didn’t were quite similar in these<br />
two groups of participants.<br />
4.1 Seeking information, support and help<br />
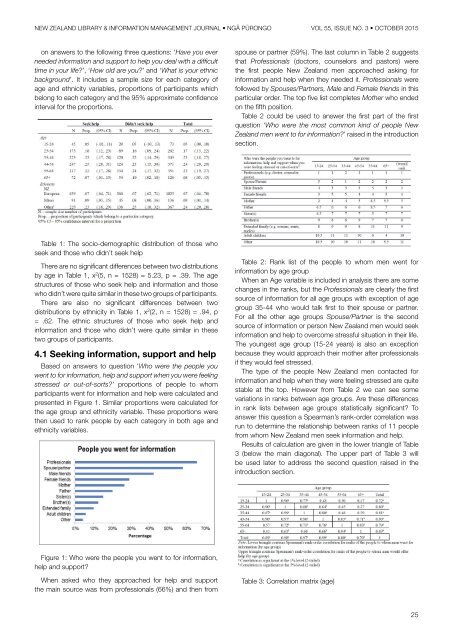
Based on answers to question ‘Who were the people you<br />
went to for information, help and support when you were feeling<br />
stressed or out-of-sorts?’ proportions of people to whom<br />
participants went for information and help were calculated and<br />
presented in Figure 1. Similar proportions were calculated for<br />
the age group and ethnicity variable. These proportions were<br />
then used to rank people by each category in both age and<br />
ethnicity variables.<br />
Table 2: Rank list of the people to whom men went for<br />
information by age group<br />
When an Age variable is included in analysis there are some<br />
changes in the ranks, but the Professionals are clearly the first<br />
source of information for all age groups with exception of age<br />
group 35-44 who would talk first to their spouse or partner.<br />
For all the other age groups Spouse/Partner is the second<br />
source of information or person New Zealand men would seek<br />
information and help to overcome stressful situation in their life.<br />
The youngest age group (15-24 years) is also an exception<br />
because they would approach their mother after professionals<br />
if they would feel stressed.<br />
The type of the people New Zealand men contacted for<br />
information and help when they were feeling stressed are quite<br />
stable at the top. However from Table 2 we can see some<br />
variations in ranks between age groups. Are these differences<br />
in rank lists between age groups statistically significant? To<br />
answer this question a Spearman’s rank-order correlation was<br />
run to determine the relationship between ranks of 11 people<br />
from whom New Zealand men seek information and help.<br />
Results of calculation are given in the lower triangle of Table<br />
3 (below the main diagonal). The upper part of Table 3 will<br />
be used later to address the second question raised in the<br />
introduction section.<br />
Figure 1: Who were the people you went to for information,<br />
help and support?<br />
When asked who they approached for help and support<br />
the main source was from professionals (66%) and then from<br />
Table 3: Correlation matrix (age)<br />
25