

THE NEW ZEALAND LIBRARY & INFORMATION MANAGEMENT JOURNAL NGĀ PŪRONGO
NZLIMJ%20Vol%2055%20Issue%203
NZLIMJ%20Vol%2055%20Issue%203

You also want an ePaper? Increase the reach of your titles
YUMPU automatically turns print PDFs into web optimized ePapers that Google loves.
<strong>NEW</strong> <strong>ZEALAND</strong> <strong>LIBRARY</strong> & <strong>INFORMATION</strong> <strong>MANAGEMENT</strong> <strong>JOURNAL</strong> • <strong>NGĀ</strong> <strong>PŪRONGO</strong> VOL 55, ISSUE NO. 3 • OCTOBER 2015<br />
The top five list completes Sister(s) who ended on the fifth<br />
position.<br />
Table 6 could be used to answer the first part of the second<br />
question ‘Who were the most common kind of people to<br />
whom New Zealand men would offer help and support when<br />
these people were feeling stressed?’ raised in the introduction<br />
section.<br />
Table 6: Rank list of the people to whom participant would<br />
offer help and support by age group<br />
When an age variable is included there are some changes<br />
in the ranks, but Male friends are the first to whom New<br />
Zealand men would offer help and support for the first three<br />
age groups. Older age groups (45-64) would offer help to their<br />
spouse/partner first while the oldest participants would offer<br />
help to their adult children first. Are these differences in rank<br />
lists between age groups statistically significant? As before, to<br />
answer this question a Spearman’s rank-order correlation was<br />
run to determine the relationship between ranks of 12 people to<br />
whom New Zealand men would offer help and support. Results<br />
of calculation are given in the upper triangle of Table 3 (above<br />
the main diagonal).<br />
The following could be inferred from Table 3 (upper triangle):<br />
• All correlations are positive, i.e. there are positive<br />
associations between ranks. In other words, if the<br />
people to whom men would offer help and support are<br />
higher ranked in one age group they will be also higher<br />
ranked in the other age group.<br />
• However, the correlation decreases as the distance<br />
between age groups increases. For instance, the rank list<br />
of the youngest age group (15-24) closely matches the<br />
rank list of the next age group (25-34). The Spearman’s<br />
rank-order correlation is 0.96 and statistically significant<br />
at the 1% level. However, correlation between the rank<br />
list of the youngest age group (15-24) and the oldest<br />
age group (65+) decreases to only 0.17 and is not<br />
statistically significant.<br />
Therefore, we would reject the null hypothesis (H2a) and<br />
conclude that the people to whom New Zealand men would<br />
offer help and support are changing with age. When they are<br />
young they would offer help to different people, than when they<br />
are seniors. However, as explained before in subsection 4.1.1<br />
these changes in the rank lists of people could be for quite<br />
trivial reason such as the availability of parents or a spouse.<br />
4.2.2 Ethnicity<br />
The rank lists in Table 7 are quite similar across three ethnic<br />
groups in spite of some small variations.<br />
Table 7: Rank list of the people to whom participant would<br />
offer help and support by ethnicity.<br />
To assess whether these variations are statistically significant<br />
a Spearman’s rank-order correlation was run to determine the<br />
relationship between ranks on these three ethnic group rank<br />
lists. Results of calculation are given in the upper triangle of<br />
Table 5 (above the main diagonal). All correlations are positive<br />
and highly statistically significant (at the 1% level) which<br />
suggests the three rank lists are quite similar. Therefore, we<br />
cannot reject the null hypothesis (H2b) and can conclude that<br />
the list of people to whom New Zealand men would offer help<br />
and support are quite similar across these three ethnic groups.<br />
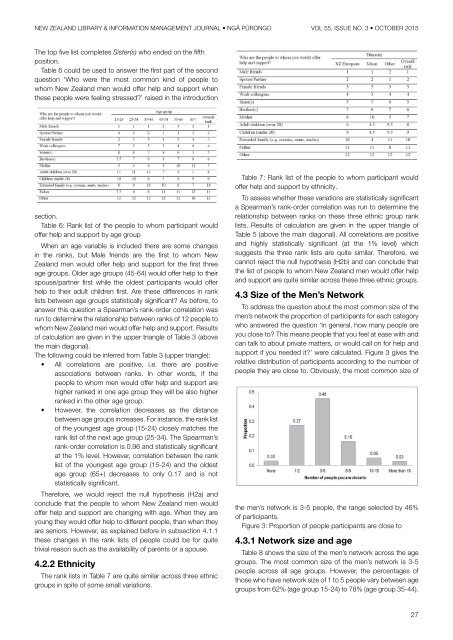
4.3 Size of the Men’s Network<br />
To address the question about the most common size of the<br />
men’s network the proportion of participants for each category<br />
who answered the question ‘In general, how many people are<br />
you close to? This means people that you feel at ease with and<br />
can talk to about private matters, or would call on for help and<br />
support if you needed it?’ were calculated. Figure 3 gives the<br />
relative distribution of participants according to the number of<br />
people they are close to. Obviously, the most common size of<br />
the men’s network is 3-5 people, the range selected by 46%<br />
of participants.<br />
Figure 3: Proportion of people participants are close to<br />
4.3.1 Network size and age<br />
Table 8 shows the size of the men’s network across the age<br />
groups. The most common size of the men’s network is 3-5<br />
people across all age groups. However, the percentages of<br />
those who have network size of 1 to 5 people vary between age<br />
groups from 62% (age group 15-24) to 78% (age group 35-44).<br />
27