BUDGET
budget
budget

You also want an ePaper? Increase the reach of your titles
YUMPU automatically turns print PDFs into web optimized ePapers that Google loves.
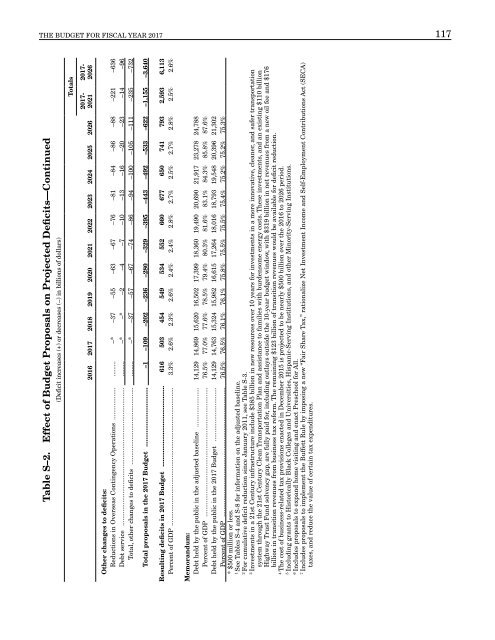
THE <strong>BUDGET</strong> FOR FISCAL YEAR 2017 117<br />
Table S–2. Effect of Budget Proposals on Projected Deficits—Continued<br />
(Deficit increases (+) or decreases (–) in billions of dollars)<br />
Totals<br />
2016 2017 2018 2019 2020 2021 2022 2023 2024 2025 2026<br />
2017-<br />
2021<br />
2017-<br />
2026<br />
Other changes to deficits:<br />
Reductions in Overseas Contingency Operations .................. ......... –* –37 –55 –63 –67 –76 –81 –84 –86 –88 –221 –636<br />
Debt service ............................................................................. ......... –* –* –2 –4 –7 –10 –13 –16 –20 –23 –14 –96<br />
Total, other changes to deficits ........................................... ......... –* –37 –57 –67 –74 –86 –94 –100 –105 –111 –235 –732<br />
Total proposals in the 2017 Budget ................................. –1 –109 –202 –236 –280 –329 –395 –443 –492 –533 –622 –1,155 –3,640<br />
Resulting deficits in 2017 Budget ............................................. 616 503 454 549 534 552 660 677 650 741 793 2,593 6,113<br />
Percent of GDP ............................................................................. 3.3% 2.6% 2.3% 2.6% 2.4% 2.4% 2.8% 2.7% 2.5% 2.7% 2.8% 2.5% 2.6%<br />
Memorandum:<br />
Debt held by the public in the adjusted baseline ...................... 14,129 14,869 15,620 16,502 17,399 18,360 19,490 20,690 21,917 23,278 24,788<br />
Percent of GDP ........................................................................ 76.5% 77.0% 77.6% 78.5% 79.4% 80.3% 81.6% 83.1% 84.3% 85.8% 87.6%<br />
Debt held by the public in the 2017 Budget .............................. 14,129 14,763 15,324 15,982 16,615 17,264 18,016 18,793 19,548 20,396 21,302<br />
Percent of GDP ........................................................................ 76.5% 76.5% 76.1% 76.1% 75.8% 75.5% 75.5% 75.4% 75.2% 75.2% 75.3%<br />
* $500 million or less.<br />
1<br />
See Tables S-4 and S-8 for information on the adjusted baseline.<br />
2<br />
For cumulative deficit reduction since January 2011, see Table S-3.<br />
3<br />
Investments in a 21st Century infrastructure include $385 billion in new resources over 10 years for investments in a more innovative, cleaner, and safer transportation<br />
system through the 21st Century Clean Transportation Plan and assistance to families with burdensome energy costs. These investments, and an existing $110 billion<br />
Highway Trust Fund solvency gap, are fully paid for, including outlays outside the 10-year budget window, with $319 billion in net revenues from a new oil fee and $176<br />
billion in transition revenues from business tax reform. The remaining $123 billion of transition revenues would be available for deficit reduction.<br />
4<br />
The cost of business-related tax provisions enacted in December 2015 is projected to be nearly $500 billion over the 2016 to 2026 period.<br />
5<br />
Including grants to Historically Black Colleges and Universities, Hispanic-Serving Institutions, and other Minority-Serving Institutions.<br />
6<br />
Includes proposals to expand home visiting and enact Preschool for All.<br />
7<br />
Includes proposals to implement the Buffett Rule by imposing a new “Fair Share Tax,” rationalize Net Investment Income and Self-Employment Contributions Act (SECA)<br />
taxes, and reduce the value of certain tax expenditures.