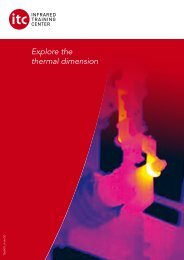
Booklet Forschung und Entwicklung EN

Create successful ePaper yourself
Turn your PDF publications into a flip-book with our unique Google optimized e-Paper software.
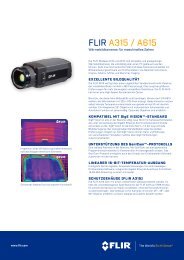
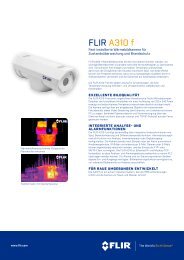
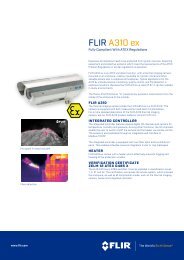
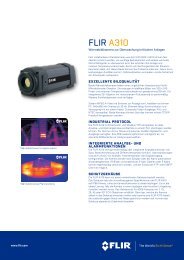
Getting The Most From Your IR Camera<br />
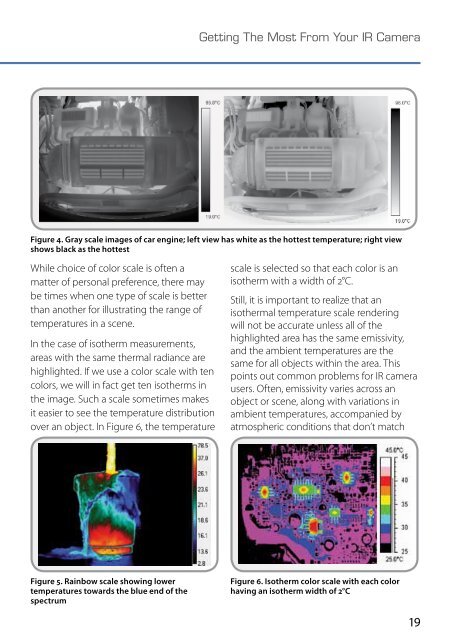
Figure 4. Gray scale images of car engine; left view has white as the hottest temperature; right view<br />
shows black as the hottest<br />
While choice of color scale is often a<br />
matter of personal preference, there may<br />
be times when one type of scale is better<br />
than another for illustrating the range of<br />
temperatures in a scene.<br />
In the case of isotherm measurements,<br />
areas with the same thermal radiance are<br />
highlighted. If we use a color scale with ten<br />
colors, we will in fact get ten isotherms in<br />
the image. Such a scale sometimes makes<br />
it easier to see the temperature distribution<br />
over an object. In Figure 6, the temperature<br />
scale is selected so that each color is an<br />
isotherm with a width of 2°C.<br />
Still, it is important to realize that an<br />
isothermal temperature scale rendering<br />
will not be accurate unless all of the<br />
highlighted area has the same emissivity,<br />
and the ambient temperatures are the<br />
same for all objects within the area. This<br />
points out common problems for IR camera<br />
users. Often, emissivity varies across an<br />
object or scene, along with variations in<br />
ambient temperatures, accompanied by<br />
atmospheric conditions that don’t match<br />
Figure 5. Rainbow scale showing lower<br />
temperatures towards the blue end of the<br />
spectrum<br />
Figure 6. Isotherm color scale with each color<br />
having an isotherm width of 2°C<br />
19