Anomaly Detection for Monitoring
anomaly-detection-monitoring
anomaly-detection-monitoring

Create successful ePaper yourself
Turn your PDF publications into a flip-book with our unique Google optimized e-Paper software.
(say, the size of the drill bit), and the control lines are fixed some<br />
number of standard deviations away from that mean. If you’ve heard<br />
of the three sigma rule, this is what it’s about. Three sigmas represents<br />
three standard deviations away from the mean. The two control<br />
lines surrounding the mean represent an acceptable range of<br />
values.<br />
The Gaussian (Normal) Distribution<br />
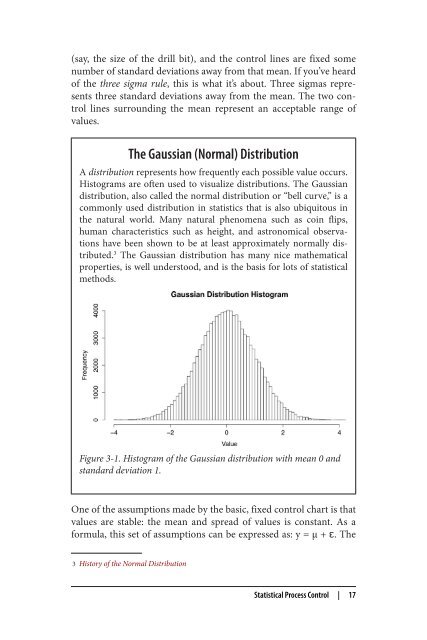
A distribution represents how frequently each possible value occurs.<br />
Histograms are often used to visualize distributions. The Gaussian<br />
distribution, also called the normal distribution or “bell curve,” is a<br />
commonly used distribution in statistics that is also ubiquitous in<br />
the natural world. Many natural phenomena such as coin flips,<br />
human characteristics such as height, and astronomical observations<br />
have been shown to be at least approximately normally distributed.<br />
3 The Gaussian distribution has many nice mathematical<br />
properties, is well understood, and is the basis <strong>for</strong> lots of statistical<br />
methods.<br />
Figure 3-1. Histogram of the Gaussian distribution with mean 0 and<br />
standard deviation 1.<br />
One of the assumptions made by the basic, fixed control chart is that<br />
values are stable: the mean and spread of values is constant. As a<br />
<strong>for</strong>mula, this set of assumptions can be expressed as: y = μ + ɛ. The<br />
3 History of the Normal Distribution<br />
Statistical Process Control | 17