Anomaly Detection for Monitoring
anomaly-detection-monitoring
anomaly-detection-monitoring

You also want an ePaper? Increase the reach of your titles
YUMPU automatically turns print PDFs into web optimized ePapers that Google loves.
Dealing with Trend<br />
Trends break models because the value of a time series with a trend<br />
isn’t stable, or stationary, over time. Using a basic, fixed control<br />
chart on a time series with an increasing trend is a bad idea because<br />
it is guaranteed to eventually exceed the upper control limit.<br />
A trend violates a lot of simple assumptions. What’s the mean of a<br />
metric that has a trend? There is no single value <strong>for</strong> the mean.<br />
Instead, the mean is actually a function with time as a parameter.<br />
What about the distribution of values? You can visualize it using a<br />
histogram, but this is misleading. Because the values increase or<br />
decrease over time due to trend, the histogram will get wider and<br />
wider over time.<br />
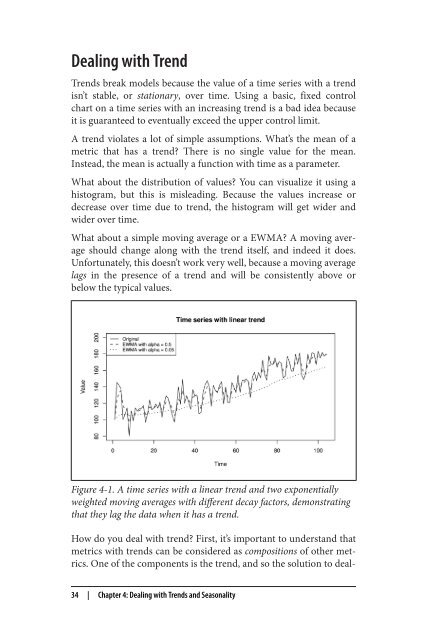
What about a simple moving average or a EWMA? A moving average<br />
should change along with the trend itself, and indeed it does.<br />
Un<strong>for</strong>tunately, this doesn’t work very well, because a moving average<br />
lags in the presence of a trend and will be consistently above or<br />
below the typical values.<br />
Figure 4-1. A time series with a linear trend and two exponentially<br />
weighted moving averages with different decay factors, demonstrating<br />
that they lag the data when it has a trend.<br />
How do you deal with trend? First, it’s important to understand that<br />
metrics with trends can be considered as compositions of other metrics.<br />
One of the components is the trend, and so the solution to deal‐<br />
34 | Chapter 4: Dealing with Trends and Seasonality