Anomaly Detection for Monitoring
anomaly-detection-monitoring
anomaly-detection-monitoring

Create successful ePaper yourself
Turn your PDF publications into a flip-book with our unique Google optimized e-Paper software.
letter μ represents a constant mean, and ɛ is a random variable representing<br />
noise or error in the system.<br />
In the case of the basic control chart model, ɛ is assumed to be a<br />
Gaussian distributed random variable.<br />
Control charts have the following characteristics:<br />
• They assume a fixed or known mean and spread of values.<br />
• The values are assumed to be Gaussian (normally) distributed<br />
around the mean.<br />
• They can detect one or multiple points that are outside the<br />
desired range.<br />
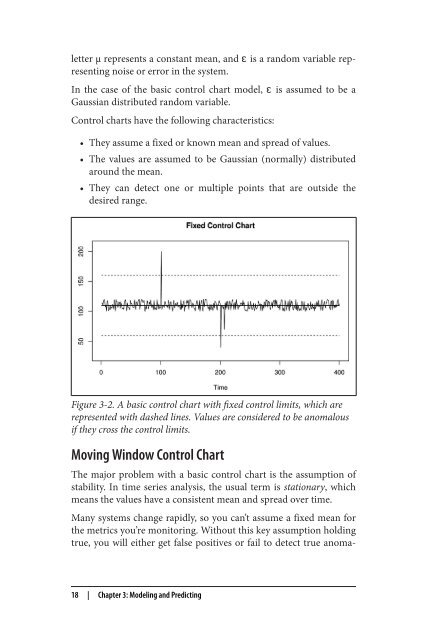
Figure 3-2. A basic control chart with fixed control limits, which are<br />
represented with dashed lines. Values are considered to be anomalous<br />
if they cross the control limits.<br />
Moving Window Control Chart<br />
The major problem with a basic control chart is the assumption of<br />
stability. In time series analysis, the usual term is stationary, which<br />
means the values have a consistent mean and spread over time.<br />
Many systems change rapidly, so you can’t assume a fixed mean <strong>for</strong><br />
the metrics you’re monitoring. Without this key assumption holding<br />
true, you will either get false positives or fail to detect true anoma‐<br />
18 | Chapter 3: Modeling and Predicting