Anomaly Detection for Monitoring
anomaly-detection-monitoring
anomaly-detection-monitoring

You also want an ePaper? Increase the reach of your titles
YUMPU automatically turns print PDFs into web optimized ePapers that Google loves.
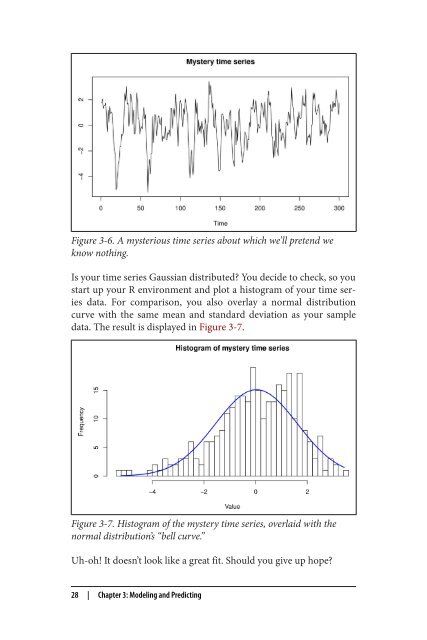
Figure 3-6. A mysterious time series about which we’ll pretend we<br />
know nothing.<br />
Is your time series Gaussian distributed? You decide to check, so you<br />
start up your R environment and plot a histogram of your time series<br />
data. For comparison, you also overlay a normal distribution<br />
curve with the same mean and standard deviation as your sample<br />
data. The result is displayed in Figure 3-7.<br />
Figure 3-7. Histogram of the mystery time series, overlaid with the<br />
normal distribution’s “bell curve.”<br />
Uh-oh! It doesn’t look like a great fit. Should you give up hope?<br />
28 | Chapter 3: Modeling and Predicting