

Lake Melville
1rw7Mns
1rw7Mns

Create successful ePaper yourself
Turn your PDF publications into a flip-book with our unique Google optimized e-Paper software.
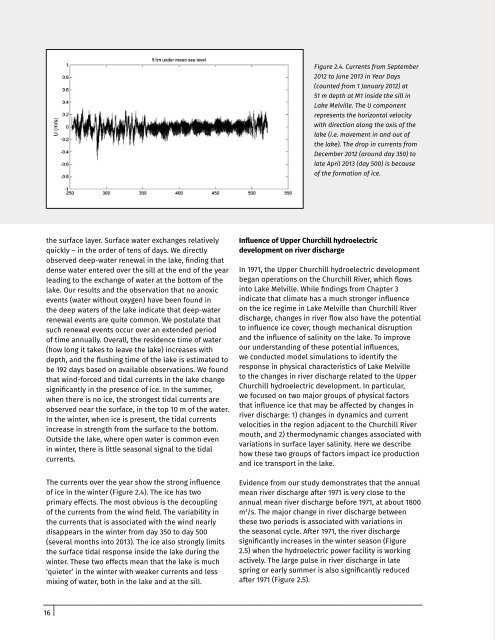
Figure 2.4. Currents from September<br />
2012 to June 2013 in Year Days<br />
(counted from 1 January 2012) at<br />
51 m depth at M1 inside the sill in<br />
<strong>Lake</strong> <strong>Melville</strong>. The U component<br />
represents the horizontal velocity<br />
with direction along the axis of the<br />
lake (i.e. movement in and out of<br />
the lake). The drop in currents from<br />
December 2012 (around day 350) to<br />
late April 2013 (day 500) is because<br />
of the formation of ice.<br />
the surface layer. Surface water exchanges relatively<br />
quickly – in the order of tens of days. We directly<br />
observed deep-water renewal in the lake, finding that<br />
dense water entered over the sill at the end of the year<br />
leading to the exchange of water at the bottom of the<br />
lake. Our results and the observation that no anoxic<br />
events (water without oxygen) have been found in<br />
the deep waters of the lake indicate that deep-water<br />
renewal events are quite common. We postulate that<br />
such renewal events occur over an extended period<br />
of time annually. Overall, the residence time of water<br />
(how long it takes to leave the lake) increases with<br />
depth, and the flushing time of the lake is estimated to<br />
be 192 days based on available observations. We found<br />
that wind-forced and tidal currents in the lake change<br />
significantly in the presence of ice. In the summer,<br />
when there is no ice, the strongest tidal currents are<br />
observed near the surface, in the top 10 m of the water.<br />
In the winter, when ice is present, the tidal currents<br />
increase in strength from the surface to the bottom.<br />
Outside the lake, where open water is common even<br />
in winter, there is little seasonal signal to the tidal<br />
currents.<br />
The currents over the year show the strong influence<br />
of ice in the winter (Figure 2.4). The ice has two<br />
primary effects. The most obvious is the decoupling<br />
of the currents from the wind field. The variability in<br />
the currents that is associated with the wind nearly<br />
disappears in the winter from day 350 to day 500<br />
(several months into 2013). The ice also strongly limits<br />
the surface tidal response inside the lake during the<br />
winter. These two effects mean that the lake is much<br />
‘quieter’ in the winter with weaker currents and less<br />
mixing of water, both in the lake and at the sill.<br />
Influence of Upper Churchill hydroelectric<br />
development on river discharge<br />
In 1971, the Upper Churchill hydroelectric development<br />
began operations on the Churchill River, which flows<br />
into <strong>Lake</strong> <strong>Melville</strong>. While findings from Chapter 3<br />
indicate that climate has a much stronger influence<br />
on the ice regime in <strong>Lake</strong> <strong>Melville</strong> than Churchill River<br />
discharge, changes in river flow also have the potential<br />
to influence ice cover, though mechanical disruption<br />
and the influence of salinity on the lake. To improve<br />
our understanding of these potential influences,<br />
we conducted model simulations to identify the<br />
response in physical characteristics of <strong>Lake</strong> <strong>Melville</strong><br />
to the changes in river discharge related to the Upper<br />
Churchill hydroelectric development. In particular,<br />
we focused on two major groups of physical factors<br />
that influence ice that may be affected by changes in<br />
river discharge: 1) changes in dynamics and current<br />
velocities in the region adjacent to the Churchill River<br />
mouth, and 2) thermodynamic changes associated with<br />
variations in surface layer salinity. Here we describe<br />
how these two groups of factors impact ice production<br />
and ice transport in the lake.<br />
Evidence from our study demonstrates that the annual<br />
mean river discharge after 1971 is very close to the<br />
annual mean river discharge before 1971, at about 1800<br />
m 3 /s. The major change in river discharge between<br />
these two periods is associated with variations in<br />
the seasonal cycle. After 1971, the river discharge<br />
significantly increases in the winter season (Figure<br />
2.5) when the hydroelectric power facility is working<br />
actively. The large pulse in river discharge in late<br />
spring or early summer is also significantly reduced<br />
after 1971 (Figure 2.5).<br />
16