

Lake Melville
1rw7Mns
1rw7Mns

You also want an ePaper? Increase the reach of your titles
YUMPU automatically turns print PDFs into web optimized ePapers that Google loves.
3.2. Methods and approach<br />
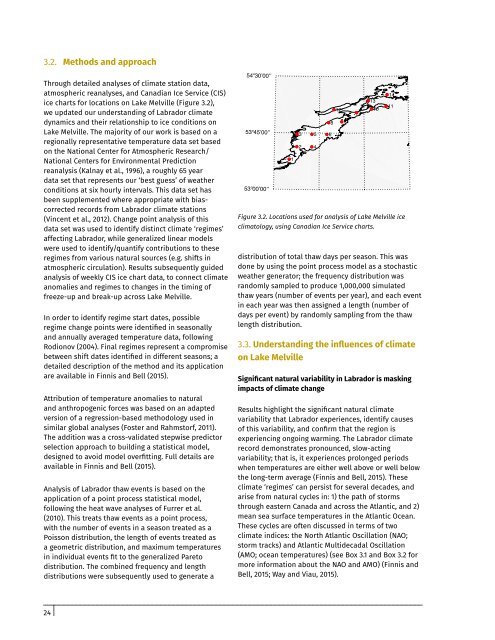
Through detailed analyses of climate station data,<br />
atmospheric reanalyses, and Canadian Ice Service (CIS)<br />
ice charts for locations on <strong>Lake</strong> <strong>Melville</strong> (Figure 3.2),<br />
we updated our understanding of Labrador climate<br />
dynamics and their relationship to ice conditions on<br />
<strong>Lake</strong> <strong>Melville</strong>. The majority of our work is based on a<br />
regionally representative temperature data set based<br />
on the National Center for Atmospheric Research/<br />
National Centers for Environmental Prediction<br />
reanalysis (Kalnay et al., 1996), a roughly 65 year<br />
data set that represents our ‘best guess’ of weather<br />
conditions at six hourly intervals. This data set has<br />
been supplemented where appropriate with biascorrected<br />
records from Labrador climate stations<br />
(Vincent et al., 2012). Change point analysis of this<br />
data set was used to identify distinct climate ‘regimes’<br />
affecting Labrador, while generalized linear models<br />
were used to identify/quantify contributions to these<br />
regimes from various natural sources (e.g. shifts in<br />
atmospheric circulation). Results subsequently guided<br />
analysis of weekly CIS ice chart data, to connect climate<br />
anomalies and regimes to changes in the timing of<br />
freeze-up and break-up across <strong>Lake</strong> <strong>Melville</strong>.<br />
In order to identify regime start dates, possible<br />
regime change points were identified in seasonally<br />
and annually averaged temperature data, following<br />
Rodionov (2004). Final regimes represent a compromise<br />
between shift dates identified in different seasons; a<br />
detailed description of the method and its application<br />
are available in Finnis and Bell (2015).<br />
Attribution of temperature anomalies to natural<br />
and anthropogenic forces was based on an adapted<br />
version of a regression-based methodology used in<br />
similar global analyses (Foster and Rahmstorf, 2011).<br />
The addition was a cross-validated stepwise predictor<br />
selection approach to building a statistical model,<br />
designed to avoid model overfitting. Full details are<br />
available in Finnis and Bell (2015).<br />
Analysis of Labrador thaw events is based on the<br />
application of a point process statistical model,<br />
following the heat wave analyses of Furrer et al.<br />
(2010). This treats thaw events as a point process,<br />
with the number of events in a season treated as a<br />
Poisson distribution, the length of events treated as<br />
a geometric distribution, and maximum temperatures<br />
in individual events fit to the generalized Pareto<br />
distribution. The combined frequency and length<br />
distributions were subsequently used to generate a<br />
54°30’00’’<br />
53°45’00’’<br />
53°00’00’’<br />
1<br />
3<br />
2<br />
5 6<br />
4<br />
distribution of total thaw days per season. This was<br />
done by using the point process model as a stochastic<br />
weather generator; the frequency distribution was<br />
randomly sampled to produce 1,000,000 simulated<br />
thaw years (number of events per year), and each event<br />
in each year was then assigned a length (number of<br />
days per event) by randomly sampling from the thaw<br />
length distribution.<br />
3.3. Understanding the influences of climate<br />
on <strong>Lake</strong> <strong>Melville</strong><br />
Significant natural variability in Labrador is masking<br />
impacts of climate change<br />
Results highlight the significant natural climate<br />
variability that Labrador experiences, identify causes<br />
of this variability, and confirm that the region is<br />
experiencing ongoing warming. The Labrador climate<br />
record demonstrates pronounced, slow-acting<br />
variability; that is, it experiences prolonged periods<br />
when temperatures are either well above or well below<br />
the long-term average (Finnis and Bell, 2015). These<br />
climate ‘regimes’ can persist for several decades, and<br />
arise from natural cycles in: 1) the path of storms<br />
through eastern Canada and across the Atlantic, and 2)<br />
mean sea surface temperatures in the Atlantic Ocean.<br />
These cycles are often discussed in terms of two<br />
climate indices: the North Atlantic Oscillation (NAO;<br />
storm tracks) and Atlantic Multidecadal Oscillation<br />
(AMO; ocean temperatures) (see Box 3.1 and Box 3.2 for<br />
more information about the NAO and AMO) (Finnis and<br />
Bell, 2015; Way and Viau, 2015).<br />
8<br />
12<br />
7<br />
9<br />
13<br />
10<br />
Figure 3.2. Locations used for analysis of <strong>Lake</strong> <strong>Melville</strong> ice<br />
climatology, using Canadian Ice Service charts.<br />
14<br />
11<br />
24