

Lake Melville
1rw7Mns
1rw7Mns

You also want an ePaper? Increase the reach of your titles
YUMPU automatically turns print PDFs into web optimized ePapers that Google loves.
Unfilt. MeHg [fM]<br />
understanding local nuances related to country foods,<br />
how they are eaten and where they are obtained,<br />
aided with interpretation of results. Informal contact<br />
with Community Research Advisors also assisted with<br />
participant recruitment, local transportation and<br />
project promotion.<br />
This work builds on research done by the Inuit Health<br />
Survey by documenting dietary information for Inuit<br />
living in Upper <strong>Lake</strong> <strong>Melville</strong> communities (North West<br />
River, Happy Valley-Goose Bay and Mud <strong>Lake</strong>, home<br />
to over 2,300 Inuit) who were not included in the Inuit<br />
Health Survey. We capture dietary changes resulting<br />
from the ban placed on the George River caribou hunt<br />
in 2013, and are able to distinguish community-level<br />
consumption patterns, as local knowledge suggested<br />
substantial differences.<br />
6.3. Methylmercury production and biological<br />
uptake in the ecosystem<br />
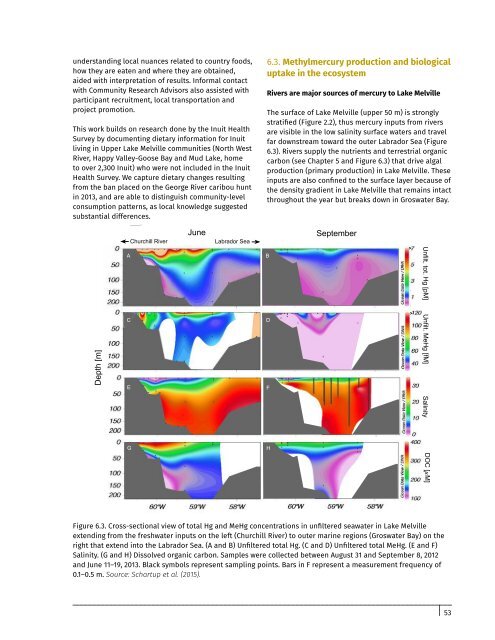
Rivers are major sources of mercury to <strong>Lake</strong> <strong>Melville</strong><br />
The surface of <strong>Lake</strong> <strong>Melville</strong> (upper 50 m) is strongly<br />
stratified (Figure 2.2), thus mercury inputs from rivers<br />
are visible in the low salinity surface waters and travel<br />
far downstream toward the outer Labrador Sea (Figure<br />
6.3). Rivers supply the nutrients and terrestrial organic<br />
carbon (see Chapter 5 and Figure 6.3) that drive algal<br />
production (primary production) in <strong>Lake</strong> <strong>Melville</strong>. These<br />
inputs are also confined to the surface layer because of<br />
the density gradient in <strong>Lake</strong> <strong>Melville</strong> that remains intact<br />
throughout the year but breaks down in Groswater Bay.<br />
Depth [m]<br />
Churchill River<br />
A<br />
C<br />
E<br />
June<br />
Labrador Sea<br />
B<br />
D<br />
F<br />
September<br />
><br />
><br />
Unfilt. tot. Hg [pM] Salinity<br />
G<br />
H<br />
DOC [µM]<br />
Figure 6.3. Cross-sectional view of total Hg and MeHg concentrations in unfiltered seawater in <strong>Lake</strong> <strong>Melville</strong><br />
extending from the freshwater inputs on the left (Churchill River) to outer marine regions (Groswater Bay) on the<br />
right that extend into the Labrador Sea. (A and B) Unfiltered total Hg. (C and D) Unfiltered total MeHg. (E and F)<br />
Salinity. (G and H) Dissolved organic carbon. Samples were collected between August 31 and September 8, 2012<br />
and June 11–19, 2013. Black symbols represent sampling points. Bars in F represent a measurement frequency of<br />
0.1–0.5 m. Source: Schartup et al. (2015).<br />
53