

Lake Melville
1rw7Mns
1rw7Mns

Create successful ePaper yourself
Turn your PDF publications into a flip-book with our unique Google optimized e-Paper software.
Likelihood of Thaw Seasons, as Return Periods (yr)<br />
300<br />
Temperature Anomaly (oC)<br />
−4 −2 0 2 4 6<br />
Raw Anomaly<br />
NAO Attributed<br />
Return Period (yrs)<br />
2010 2011<br />
200<br />
100<br />
0<br />
Goose Bay Nain Cartwright Churchill Falls Wabush<br />
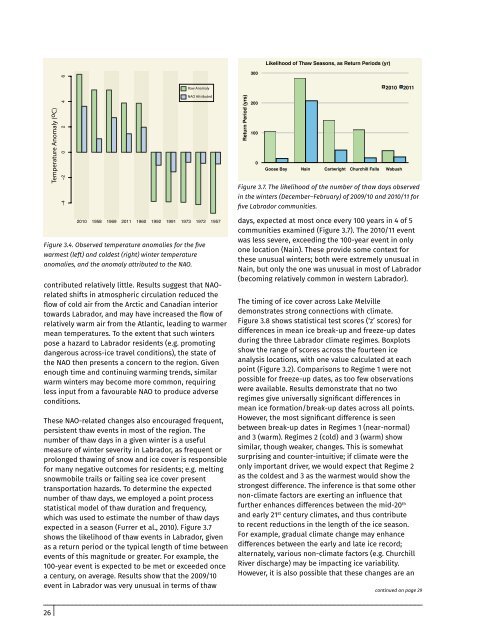
Figure 3.7. The likelihood of the number of thaw days observed<br />
in the winters (December–February) of 2009/10 and 2010/11 for<br />
five Labrador communities.<br />
2010 1958 1969 2011 1960 1992 1991 1973 1972 1957<br />
Figure 3.4. Observed temperature anomalies for the five<br />
warmest (left) and coldest (right) winter temperature<br />
anomalies, and the anomaly attributed to the NAO.<br />
contributed relatively little. Results suggest that NAOrelated<br />
shifts in atmospheric circulation reduced the<br />
flow of cold air from the Arctic and Canadian interior<br />
towards Labrador, and may have increased the flow of<br />
relatively warm air from the Atlantic, leading to warmer<br />
mean temperatures. To the extent that such winters<br />
pose a hazard to Labrador residents (e.g. promoting<br />
dangerous across-ice travel conditions), the state of<br />
the NAO then presents a concern to the region. Given<br />
enough time and continuing warming trends, similar<br />
warm winters may become more common, requiring<br />
less input from a favourable NAO to produce adverse<br />
conditions.<br />
These NAO-related changes also encouraged frequent,<br />
persistent thaw events in most of the region. The<br />
number of thaw days in a given winter is a useful<br />
measure of winter severity in Labrador, as frequent or<br />
prolonged thawing of snow and ice cover is responsible<br />
for many negative outcomes for residents; e.g. melting<br />
snowmobile trails or failing sea ice cover present<br />
transportation hazards. To determine the expected<br />
number of thaw days, we employed a point process<br />
statistical model of thaw duration and frequency,<br />
which was used to estimate the number of thaw days<br />
expected in a season (Furrer et al., 2010). Figure 3.7<br />
shows the likelihood of thaw events in Labrador, given<br />
as a return period or the typical length of time between<br />
events of this magnitude or greater. For example, the<br />
100-year event is expected to be met or exceeded once<br />
a century, on average. Results show that the 2009/10<br />
event in Labrador was very unusual in terms of thaw<br />
days, expected at most once every 100 years in 4 of 5<br />
communities examined (Figure 3.7). The 2010/11 event<br />
was less severe, exceeding the 100-year event in only<br />
one location (Nain). These provide some context for<br />
these unusual winters; both were extremely unusual in<br />
Nain, but only the one was unusual in most of Labrador<br />
(becoming relatively common in western Labrador).<br />
The timing of ice cover across <strong>Lake</strong> <strong>Melville</strong><br />
demonstrates strong connections with climate.<br />
Figure 3.8 shows statistical test scores (‘z’ scores) for<br />
differences in mean ice break-up and freeze-up dates<br />
during the three Labrador climate regimes. Boxplots<br />
show the range of scores across the fourteen ice<br />
analysis locations, with one value calculated at each<br />
point (Figure 3.2). Comparisons to Regime 1 were not<br />
possible for freeze-up dates, as too few observations<br />
were available. Results demonstrate that no two<br />
regimes give universally significant differences in<br />
mean ice formation/break-up dates across all points.<br />
However, the most significant difference is seen<br />
between break-up dates in Regimes 1 (near-normal)<br />
and 3 (warm). Regimes 2 (cold) and 3 (warm) show<br />
similar, though weaker, changes. This is somewhat<br />
surprising and counter-intuitive; if climate were the<br />
only important driver, we would expect that Regime 2<br />
as the coldest and 3 as the warmest would show the<br />
strongest difference. The inference is that some other<br />
non-climate factors are exerting an influence that<br />
further enhances differences between the mid-20 th<br />
and early 21 st century climates, and thus contribute<br />
to recent reductions in the length of the ice season.<br />
For example, gradual climate change may enhance<br />
differences between the early and late ice record;<br />
alternately, various non-climate factors (e.g. Churchill<br />
River discharge) may be impacting ice variability.<br />
However, it is also possible that these changes are an<br />
continued on page 29<br />
26