

Corporate Responsibility & Sustainability Report 2015/2016
1XlqBpD
1XlqBpD

You also want an ePaper? Increase the reach of your titles
YUMPU automatically turns print PDFs into web optimized ePapers that Google loves.
CORPORATE RESPONSIBILITY & SUSTAINABILITY REPORT <strong>2015</strong> — <strong>2016</strong><br />
Our Carbon<br />
Footprint<br />
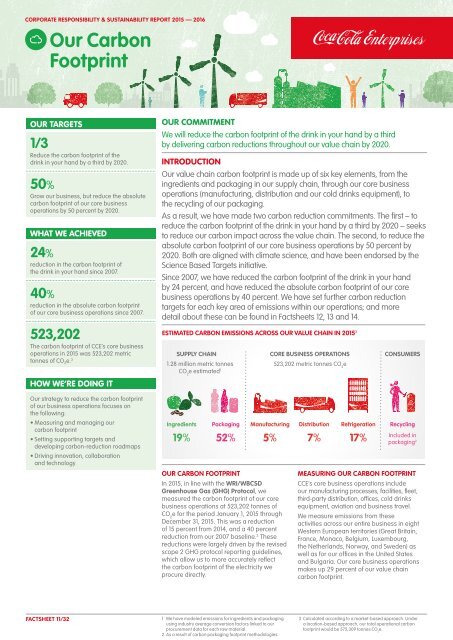
OUR TARGETS<br />
1/3<br />
Reduce the carbon footprint of the<br />
drink in your hand by a third by 2020.<br />
50%<br />
Grow our business, but reduce the absolute<br />
carbon footprint of our core business<br />
operations by 50 percent by 2020.<br />
WHAT WE ACHIEVED<br />
24%<br />
reduction in the carbon footprint of<br />
the drink in your hand since 2007.<br />
40%<br />
reduction in the absolute carbon footprint<br />
of our core business operations since 2007.<br />
523,202<br />
The carbon footprint of CCE’s core business<br />
operations in <strong>2015</strong> was 523,202 metric<br />
tonnes of CO 2 e. 3<br />
HOW WE’RE DOING IT<br />
OUR COMMITMENT<br />
We will reduce the carbon footprint of the drink in your hand by a third<br />
by delivering carbon reductions throughout our value chain by 2020.<br />
INTRODUCTION<br />
Our value chain carbon footprint is made up of six key elements, from the<br />
ingredients and packaging in our supply chain, through our core business<br />
operations (manufacturing, distribution and our cold drinks equipment), to<br />
the recycling of our packaging.<br />
As a result, we have made two carbon reduction commitments. The first – to<br />
reduce the carbon footprint of the drink in your hand by a third by 2020 – seeks<br />
to reduce our carbon impact across the value chain. The second, to reduce the<br />
absolute carbon footprint of our core business operations by 50 percent by<br />
2020. Both are aligned with climate science, and have been endorsed by the<br />
Science Based Targets initiative.<br />
Since 2007, we have reduced the carbon footprint of the drink in your hand<br />
by 24 percent, and have reduced the absolute carbon footprint of our core<br />
business operations by 40 percent. We have set further carbon reduction<br />
targets for each key area of emissions within our operations; and more<br />
detail about these can be found in Factsheets 12, 13 and 14.<br />
ESTIMATED CARBON EMISSIONS ACROSS OUR VALUE CHAIN IN <strong>2015</strong> 3<br />
SUPPLY CHAIN CORE BUSINESS OPERATIONS CONSUMERS<br />
1.28 million metric tonnes<br />
523,202 metric tonnes CO 2<br />
e<br />
CO 2<br />
e estimated 1<br />
Our strategy to reduce the carbon footprint<br />
of our business operations focuses on<br />
the following:<br />
• Measuring and managing our<br />
carbon footprint<br />
• Setting supporting targets and<br />
developing carbon-reduction roadmaps<br />
• Driving innovation, collaboration<br />
and technology<br />
Ingredients<br />
19%<br />
Packaging<br />
52%<br />
Manufacturing<br />
5%<br />
OUR CARBON FOOTPRINT<br />
In <strong>2015</strong>, in line with the WRI/WBCSD<br />
Greenhouse Gas (GHG) Protocol, we<br />
measured the carbon footprint of our core<br />
business operations at 523,202 tonnes of<br />
CO 2<br />
e for the period January 1, <strong>2015</strong> through<br />
December 31, <strong>2015</strong>. This was a reduction<br />
of 15 percent from 2014, and a 40 percent<br />
reduction from our 2007 baseline. 3 These<br />
reductions were largely driven by the revised<br />
scope 2 GHG protocol reporting guidelines,<br />
which allow us to more accurately reflect<br />
the carbon footprint of the electricity we<br />
procure directly.<br />
Distribution<br />
7%<br />
Refrigeration<br />
17%<br />
Recycling<br />
Included in<br />
packaging 2<br />
MEASURING OUR CARBON FOOTPRINT<br />
CCE’s core business operations include<br />
our manufacturing processes, facilities, fleet,<br />
third-party distribution, offices, cold drinks<br />
equipment, aviation and business travel.<br />
We measure emissions from these<br />
activities across our entire business in eight<br />
Western European territories (Great Britain,<br />
France, Monaco, Belgium, Luxembourg,<br />
the Netherlands, Norway, and Sweden) as<br />
well as for our offices in the United States<br />
and Bulgaria. Our core business operations<br />
makes up 29 percent of our value chain<br />
carbon footprint.<br />
FACTSHEET 11/32<br />
1 We have modeled emissions for ingredients and packaging<br />
using industry average conversion factors linked to our<br />
procurement data for each raw material.<br />
2 As a result of carbon packaging footprint methodologies.<br />
3 Calculated according to a market-based approach. Under<br />
a location-based approach, our total operational carbon<br />
footprint would be 572,309 tonnes CO 2<br />
e.