

1U08p2c
1U08p2c
1U08p2c

You also want an ePaper? Increase the reach of your titles
YUMPU automatically turns print PDFs into web optimized ePapers that Google loves.
conditions (move out of shacks) or gain access to important infrastructure and amenities. This<br />
could be due to both improved government service delivery during this time, and a natural<br />
process whereby new migrants to cities manage to improve their living conditions over time,<br />
consistent with a “modernization theory of slums” (Marx et al., 2013). Indeed many of the<br />
households in informal housing in the first wave of the panel were recent migrants to the city.<br />
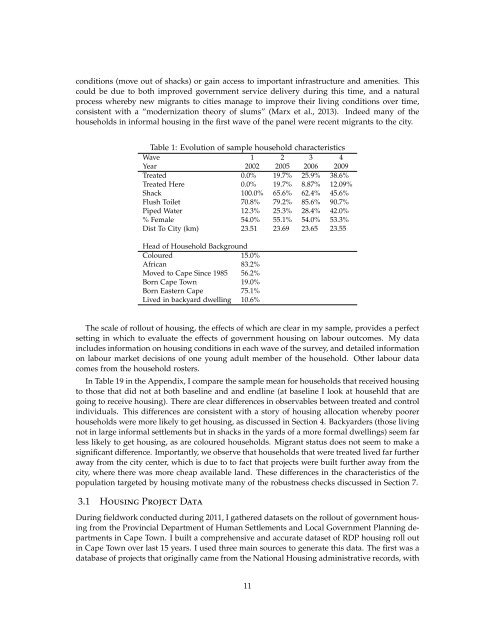
Table 1: Evolution of sample household characteristics<br />
Wave 1 2 3 4<br />
Year 2002 2005 2006 2009<br />
Treated 0.0% 19.7% 25.9% 38.6%<br />
Treated Here 0.0% 19.7% 8.87% 12.09%<br />
Shack 100.0% 65.6% 62.4% 45.6%<br />
Flush Toilet 70.8% 79.2% 85.6% 90.7%<br />
Piped Water 12.3% 25.3% 28.4% 42.0%<br />
% Female 54.0% 55.1% 54.0% 53.3%<br />
Dist To City (km) 23.51 23.69 23.65 23.55<br />
Head of Household Background<br />
Coloured 15.0%<br />
African 83.2%<br />
Moved to Cape Since 1985 56.2%<br />
Born Cape Town 19.0%<br />
Born Eastern Cape 75.1%<br />
Lived in backyard dwelling 10.6%<br />
The scale of rollout of housing, the effects of which are clear in my sample, provides a perfect<br />
setting in which to evaluate the effects of government housing on labour outcomes. My data<br />
includes information on housing conditions in each wave of the survey, and detailed information<br />
on labour market decisions of one young adult member of the household. Other labour data<br />
comes from the household rosters.<br />
In Table 19 in the Appendix, I compare the sample mean for households that received housing<br />
to those that did not at both baseline and and endline (at baseline I look at househld that are<br />
going to receive housing). There are clear differences in observables between treated and control<br />
individuals. This differences are consistent with a story of housing allocation whereby poorer<br />
households were more likely to get housing, as discussed in Section 4. Backyarders (those living<br />
not in large informal settlements but in shacks in the yards of a more formal dwellings) seem far<br />
less likely to get housing, as are coloured households. Migrant status does not seem to make a<br />
significant difference. Importantly, we observe that households that were treated lived far further<br />
away from the city center, which is due to to fact that projects were built further away from the<br />
city, where there was more cheap available land. These differences in the characteristics of the<br />
population targeted by housing motivate many of the robustness checks discussed in Section 7.<br />
3.1 Housing Project Data<br />
During fieldwork conducted during 2011, I gathered datasets on the rollout of government housing<br />
from the Provincial Department of Human Settlements and Local Government Planning departments<br />
in Cape Town. I built a comprehensive and accurate dataset of RDP housing roll out<br />
in Cape Town over last 15 years. I used three main sources to generate this data. The first was a<br />
database of projects that originally came from the National Housing administrative records, with<br />
11