

1U08p2c
1U08p2c
1U08p2c

You also want an ePaper? Increase the reach of your titles
YUMPU automatically turns print PDFs into web optimized ePapers that Google loves.
3.2 Location and Proximity Measures<br />
I used confidential datasets in order to track households as they moved. 26 I used original enumeration<br />
areas maps to locate the original living location of households in the first wave of<br />
the sample, then used household addresses from survey tracking sheets to update household<br />
locations as they moved.<br />
I used ArcGIS maps of the original EAs sampled to map the approximate locations of the<br />
households at the start of the survey. I then used household’s addresses in later waves, transcribed<br />
from the survey documents, to identify households that had changed address. I then<br />
geocoded the new addresses. In this way I tracked households throughout the four waves by<br />
their GPS coordinates. 27 I was then able to generate a range of distance and geographic outcomes<br />
for each household. In each wave of data I calculated the distance from schools, roads,<br />
the city centre, and the distance of move from the original place of living at the basline (if there<br />
was any move at all).<br />
Summary statistics of the migration data are presented in table 2, along with the housing<br />
distance data described in the next section. Roughly 30% of the sample moved at some point<br />
during the survey. 28 The average move distance is small, under 1 km. 29 This data gives an idea<br />
of how far informal households live from the city centre- 26kms on average.<br />
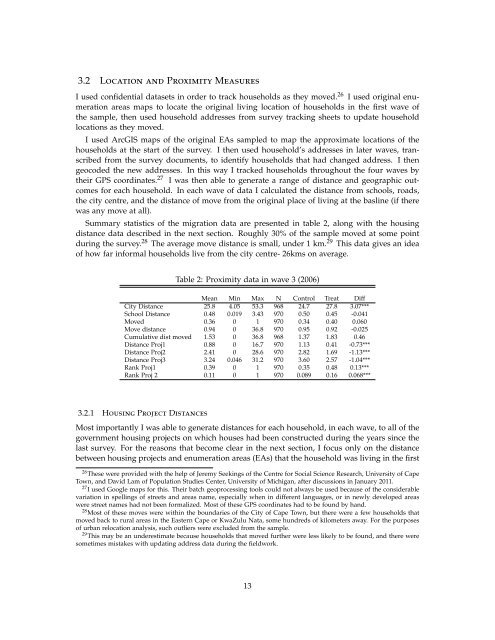
Table 2: Proximity data in wave 3 (2006)<br />
Mean Min Max N Control Treat Diff<br />
City Distance 25.8 4.05 53.3 968 24.7 27.8 3.07***<br />
School Distance 0.48 0.019 3.43 970 0.50 0.45 -0.041<br />
Moved 0.36 0 1 970 0.34 0.40 0.060<br />
Move distance 0.94 0 36.8 970 0.95 0.92 -0.025<br />
Cumulative dist moved 1.53 0 36.8 968 1.37 1.83 0.46<br />
Distance Proj1 0.88 0 16.7 970 1.13 0.41 -0.73***<br />
Distance Proj2 2.41 0 28.6 970 2.82 1.69 -1.13***<br />
Distance Proj3 3.24 0.046 31.2 970 3.60 2.57 -1.04***<br />
Rank Proj1 0.39 0 1 970 0.35 0.48 0.13***<br />
Rank Proj 2 0.11 0 1 970 0.089 0.16 0.068***<br />
3.2.1 Housing Project Distances<br />
Most importantly I was able to generate distances for each household, in each wave, to all of the<br />
government housing projects on which houses had been constructed during the years since the<br />
last survey. For the reasons that become clear in the next section, I focus only on the distance<br />
between housing projects and enumeration areas (EAs) that the household was living in the first<br />
26 These were provided with the help of Jeremy Seekings of the Centre for Social Science Research, University of Cape<br />
Town, and David Lam of Population Studies Center, University of Michigan, after discussions in January 2011.<br />
27 I used Google maps for this. Their batch geoprocessing tools could not always be used because of the considerable<br />
variation in spellings of streets and areas name, especially when in different languages, or in newly developed areas<br />
were street names had not been formalized. Most of these GPS coordinates had to be found by hand.<br />
28 Most of these moves were within the boundaries of the City of Cape Town, but there were a few households that<br />
moved back to rural areas in the Eastern Cape or KwaZulu Nata, some hundreds of kilometers away. For the purposes<br />
of urban relocation analysis, such outliers were excluded from the sample.<br />
29 This may be an underestimate because households that moved further were less likely to be found, and there were<br />
sometimes mistakes with updating address data during the fieldwork.<br />
13