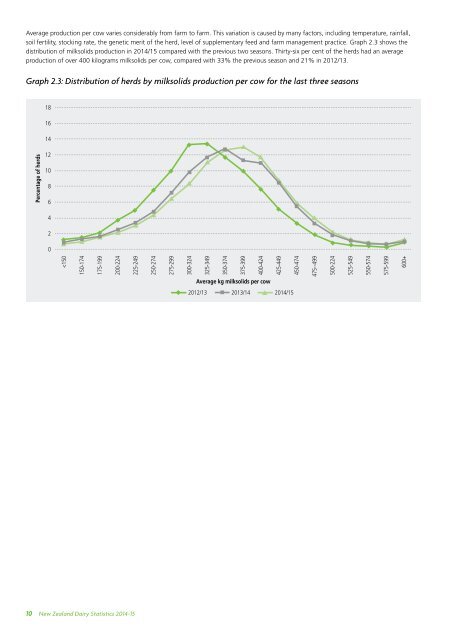
Average production per cow varies considerably from farm to farm. This variation is caused by many factors, including temperature, rainfall, soil fertility, stocking rate, the genetic merit of the herd, level of supplementary feed and farm management practice. Graph 2.3 shows the distribution of milksolids production in <strong>2014</strong>/<strong>15</strong> compared with the previous two seasons. Thirty-six per cent of the herds had an average production of over 400 kilograms milksolids per cow, compared with 33% the previous season and 21% in 2012/13. Graph 2.3: Distribution of herds by milksolids production per cow for the last three seasons Percentage of herds 18 16 14 12 10 8 6 4 2 0
ii) Herd size distribution • 12% of herds have 750 or more cows A little over 50% (6,135) of herds have between 100 and 349 cows (Table 2.4). In <strong>2014</strong>/<strong>15</strong>, 3,435 (29%) had 500 or more cows, 1,458 (12%) had 750 or more cows, and 612 (5%) had 1,000 cows or more. Averages of milkfat, protein and milksolids per cow, by herd size, are also included in Table 2.4. Aside from the 225 herds with fewer than 100 animals, the average milksolids per cow varies between 306 kg (herds with 1,500+ cows) and 398 kg (herds with 850-899 cows). Table 2.4: Average production per cow by herd size in <strong>2014</strong>/<strong>15</strong> Herd size Number of herds Percentage of herds Number of cows Percentage of cows Average kg milkfat per cow Average kg protein per cow Average kg milksolids per cow 10-49 6 0.1 231 0.0 230 172 401 50-99 219 1.8 17,134 0.3 <strong>15</strong>3 117 270 100-149 714 6.0 89,597 1.8 189 145 334 <strong>15</strong>0-199 1,309 10.9 226,428 4.5 202 <strong>15</strong>4 356 200-249 1,658 13.9 366,074 7.3 210 160 370 250-299 1,244 10.4 334,886 6.7 214 163 377 300-349 1,210 10.1 386,006 7.7 212 162 374 350-399 806 6.7 297,219 5.9 214 163 377 400-449 783 6.5 327,432 6.5 218 167 384 450-499 586 4.9 274,172 5.5 216 166 382 500-549 568 4.7 292,861 5.8 220 169 389 550-599 445 3.7 253,463 5.1 217 167 384 600-649 414 3.5 254,884 5.1 222 171 393 650-699 282 2.4 187,661 3.7 219 170 388 700-749 268 2.2 191,461 3.8 220 173 393 750-799 233 1.9 178,809 3.6 220 172 392 800-849 221 1.8 179,665 3.6 221 172 393 850-899 131 1.1 113,427 2.3 224 174 398 900-949 161 1.3 146,749 2.9 219 169 388 950-999 100 0.8 96,409 1.9 218 171 389 1000-1099 182 1.5 186,916 3.7 213 166 379 1100-1199 129 1.1 146,395 2.9 2<strong>15</strong> 169 384 1200-1499 168 1.4 218,943 4.4 210 164 375 <strong>15</strong>00+ 133 1.1 251,511 5.0 172 134 306 Total/Avg 11,970 5,018,333 213 164 377 <strong>New</strong> <strong>Zealand</strong> <strong>Dairy</strong> <strong>Statistics</strong> <strong>2014</strong>-<strong>15</strong> 11