

New Zealand Dairy Statistics 2014-15
DAIRY%20STATISTICS%202014-15-WEB-6%20NOV%2015
DAIRY%20STATISTICS%202014-15-WEB-6%20NOV%2015

You also want an ePaper? Increase the reach of your titles
YUMPU automatically turns print PDFs into web optimized ePapers that Google loves.
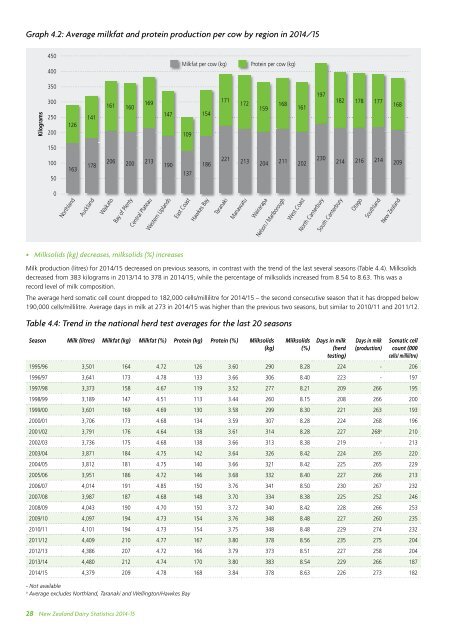
Graph 4.2: Average milkfat and protein production per cow by region in <strong>2014</strong>/<strong>15</strong><br />
450<br />
400<br />
Milkfat per cow (kg)<br />
Protein per cow (kg)<br />
Kilograms<br />
350<br />
300<br />
250<br />
200<br />
126<br />
141<br />
161<br />
160<br />
169<br />
147<br />
109<br />
<strong>15</strong>4<br />
171<br />
172<br />
<strong>15</strong>9<br />
168<br />
161<br />
197<br />
182<br />
178<br />
177<br />
168<br />
<strong>15</strong>0<br />
100<br />
50<br />
163<br />
178<br />
206<br />
200<br />
213<br />
190<br />
137<br />
186<br />
221<br />
213<br />
204<br />
211<br />
202<br />
230<br />
214<br />
216<br />
214<br />
209<br />
0<br />
Northland<br />
Auckland<br />
Waikato<br />
Bay of Plenty<br />
Central Plateau<br />
Western Uplands<br />
East Coast<br />
Hawkes Hawkes Bay<br />
Taranaki<br />
Manawatu<br />
Wairarapa<br />
Nelson / Marlborough<br />
West Coast<br />
North Canterbury<br />
South Canterbury<br />
Otago<br />
Southland<br />
<strong>New</strong> <strong>Zealand</strong><br />
• Milksolids (kg) decreases, milksolids (%) increases<br />
Milk production (litres) for <strong>2014</strong>/<strong>15</strong> decreased on previous seasons, in contrast with the trend of the last several seasons (Table 4.4). Milksolids<br />
decreased from 383 kilograms in 2013/14 to 378 in <strong>2014</strong>/<strong>15</strong>, while the percentage of milksolids increased from 8.54 to 8.63. This was a<br />
record level of milk composition.<br />
The average herd somatic cell count dropped to 182,000 cells/millilitre for <strong>2014</strong>/<strong>15</strong> – the second consecutive season that it has dropped below<br />
190,000 cells/millilitre. Average days in milk at 273 in <strong>2014</strong>/<strong>15</strong> was higher than the previous two seasons, but similar to 2010/11 and 2011/12.<br />
Table 4.4: Trend in the national herd test averages for the last 20 seasons<br />
Season Milk (litres) Milkfat (kg) Milkfat (%) Protein (kg) Protein (%) Milksolids<br />
(kg)<br />
Milksolids<br />
(%)<br />
Days in milk<br />
(herd<br />
testing)<br />
Days in milk<br />
(production)<br />
Somatic cell<br />
count (000<br />
cells/ millilitre)<br />
1995/96 3,501 164 4.72 126 3.60 290 8.28 224 - 206<br />
1996/97 3,641 173 4.78 133 3.66 306 8.40 223 - 197<br />
1997/98 3,373 <strong>15</strong>8 4.67 119 3.52 277 8.21 209 266 195<br />
1998/99 3,189 147 4.51 113 3.44 260 8.<strong>15</strong> 208 266 200<br />
1999/00 3,601 169 4.69 130 3.58 299 8.30 221 263 193<br />
2000/01 3,706 173 4.68 134 3.59 307 8.28 224 268 196<br />
2001/02 3,791 176 4.64 138 3.61 314 8.28 227 268 a 210<br />
2002/03 3,736 175 4.68 138 3.66 313 8.38 219 - 213<br />
2003/04 3,871 184 4.75 142 3.64 326 8.42 224 265 220<br />
2004/05 3,812 181 4.75 140 3.66 321 8.42 225 265 229<br />
2005/06 3,951 186 4.72 146 3.68 332 8.40 227 266 213<br />
2006/07 4,014 191 4.85 <strong>15</strong>0 3.76 341 8.50 230 267 232<br />
2007/08 3,987 187 4.68 148 3.70 334 8.38 225 252 246<br />
2008/09 4,043 190 4.70 <strong>15</strong>0 3.72 340 8.42 228 266 253<br />
2009/10 4,097 194 4.73 <strong>15</strong>4 3.76 348 8.48 227 260 235<br />
2010/11 4,101 194 4.73 <strong>15</strong>4 3.75 348 8.48 229 274 232<br />
2011/12 4,409 210 4.77 167 3.80 378 8.56 235 275 204<br />
2012/13 4,386 207 4.72 166 3.79 373 8.51 227 258 204<br />
2013/14 4,480 212 4.74 170 3.80 383 8.54 229 266 187<br />
<strong>2014</strong>/<strong>15</strong> 4,379 209 4.78 168 3.84 378 8.63 226 273 182<br />
- Not available<br />
a<br />
Average excludes Northland, Taranaki and Wellington/Hawkes Bay<br />
28<br />
<strong>New</strong> <strong>Zealand</strong> <strong>Dairy</strong> <strong>Statistics</strong> <strong>2014</strong>-<strong>15</strong>