

New Zealand Dairy Statistics 2014-15
DAIRY%20STATISTICS%202014-15-WEB-6%20NOV%2015
DAIRY%20STATISTICS%202014-15-WEB-6%20NOV%2015

You also want an ePaper? Increase the reach of your titles
YUMPU automatically turns print PDFs into web optimized ePapers that Google loves.
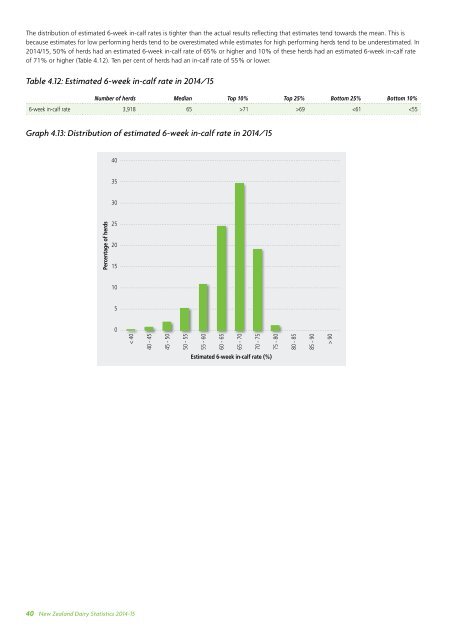
The distribution of estimated 6-week in-calf rates is tighter than the actual results reflecting that estimates tend towards the mean. This is<br />
because estimates for low performing herds tend to be overestimated while estimates for high performing herds tend to be underestimated. In<br />
<strong>2014</strong>/<strong>15</strong>, 50% of herds had an estimated 6-week in-calf rate of 65% or higher and 10% of these herds had an estimated 6-week in-calf rate<br />
of 71% or higher (Table 4.12). Ten per cent of herds had an in-calf rate of 55% or lower.<br />
Table 4.12: Estimated 6-week in-calf rate in <strong>2014</strong>/<strong>15</strong><br />
Number of herds Median Top 10% Top 25% Bottom 25% Bottom 10%<br />
6-week in-calf rate 3,918 65 >71 >69