

New Zealand Dairy Statistics 2014-15
DAIRY%20STATISTICS%202014-15-WEB-6%20NOV%2015
DAIRY%20STATISTICS%202014-15-WEB-6%20NOV%2015

You also want an ePaper? Increase the reach of your titles
YUMPU automatically turns print PDFs into web optimized ePapers that Google loves.
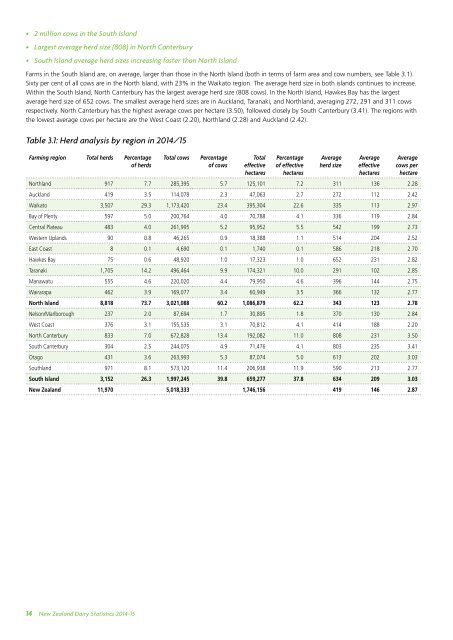
• 2 million cows in the South Island<br />
• Largest average herd size (808) in North Canterbury<br />
• South Island average herd sizes increasing faster than North Island<br />
Farms in the South Island are, on average, larger than those in the North Island (both in terms of farm area and cow numbers, see Table 3.1).<br />
Sixty per cent of all cows are in the North Island, with 23% in the Waikato region. The average herd size in both islands continues to increase.<br />
Within the South Island, North Canterbury has the largest average herd size (808 cows). In the North Island, Hawkes Bay has the largest<br />
average herd size of 652 cows. The smallest average herd sizes are in Auckland, Taranaki, and Northland, averaging 272, 291 and 311 cows<br />
respectively. North Canterbury has the highest average cows per hectare (3.50), followed closely by South Canterbury (3.41). The regions with<br />
the lowest average cows per hectare are the West Coast (2.20), Northland (2.28) and Auckland (2.42).<br />
Table 3.1: Herd analysis by region in <strong>2014</strong>/<strong>15</strong><br />
Farming region Total herds Percentage<br />
of herds<br />
Total cows<br />
Percentage<br />
of cows<br />
Total<br />
effective<br />
hectares<br />
Percentage<br />
of effective<br />
hectares<br />
Average<br />
herd size<br />
Average<br />
effective<br />
hectares<br />
Average<br />
cows per<br />
hectare<br />
Northland 917 7.7 285,395 5.7 125,101 7.2 311 136 2.28<br />
Auckland 419 3.5 114,078 2.3 47,063 2.7 272 112 2.42<br />
Waikato 3,507 29.3 1,173,420 23.4 395,304 22.6 335 113 2.97<br />
Bay of Plenty 597 5.0 200,764 4.0 70,788 4.1 336 119 2.84<br />
Central Plateau 483 4.0 261,995 5.2 95,952 5.5 542 199 2.73<br />
Western Uplands 90 0.8 46,265 0.9 18,388 1.1 514 204 2.52<br />
East Coast 8 0.1 4,690 0.1 1,740 0.1 586 218 2.70<br />
Hawkes Bay 75 0.6 48,920 1.0 17,323 1.0 652 231 2.82<br />
Taranaki 1,705 14.2 496,464 9.9 174,321 10.0 291 102 2.85<br />
Manawatu 555 4.6 220,020 4.4 79,950 4.6 396 144 2.75<br />
Wairarapa 462 3.9 169,077 3.4 60,949 3.5 366 132 2.77<br />
North Island 8,818 73.7 3,021,088 60.2 1,086,879 62.2 343 123 2.78<br />
Nelson/Marlborough 237 2.0 87,694 1.7 30,895 1.8 370 130 2.84<br />
West Coast 376 3.1 <strong>15</strong>5,535 3.1 70,812 4.1 414 188 2.20<br />
North Canterbury 833 7.0 672,828 13.4 192,082 11.0 808 231 3.50<br />
South Canterbury 304 2.5 244,075 4.9 71,476 4.1 803 235 3.41<br />
Otago 431 3.6 263,993 5.3 87,074 5.0 613 202 3.03<br />
Southland 971 8.1 573,120 11.4 206,938 11.9 590 213 2.77<br />
South Island 3,<strong>15</strong>2 26.3 1,997,245 39.8 659,277 37.8 634 209 3.03<br />
<strong>New</strong> <strong>Zealand</strong> 11,970 5,018,333 1,746,<strong>15</strong>6 419 146 2.87<br />
14<br />
<strong>New</strong> <strong>Zealand</strong> <strong>Dairy</strong> <strong>Statistics</strong> <strong>2014</strong>-<strong>15</strong>